The euro follows my tramlines in the charts
The media is full of the news that the European Central Bank is under pressure to print. But as John C Burford explains, the charts were well ahead of the game.
Get the latest financial news, insights and expert analysis from our award-winning MoneyWeek team, to help you understand what really matters when it comes to your finances.
You are now subscribed
Your newsletter sign-up was successful
Want to add more newsletters?

Twice daily
MoneyWeek
Get the latest financial news, insights and expert analysis from our award-winning MoneyWeek team, to help you understand what really matters when it comes to your finances.

Four times a week
Look After My Bills
Sign up to our free money-saving newsletter, filled with the latest news and expert advice to help you find the best tips and deals for managing your bills. Start saving today!
In recent days, the euro has been the subject of concerted selling. The reason for this is that the market believes the European Central Bank is under pressure to lower its policy interest rate from 0.5% to 0.25%, or even lower.
This sentiment is the result of the eurozone's rapidly declining CPI (consumer price index), which is perilously close to running through the zero line and into outright deflation.
Finally, demand in the eurozone remains weak and unemployment is still stubbornly high. It seems that there is little prospect for the kind of growth needed to pull the economy around and avoid a deflationary trap.
MoneyWeek
Subscribe to MoneyWeek today and get your first six magazine issues absolutely FREE

Sign up to Money Morning
Don't miss the latest investment and personal finances news, market analysis, plus money-saving tips with our free twice-daily newsletter
Don't miss the latest investment and personal finances news, market analysis, plus money-saving tips with our free twice-daily newsletter
Or at least that is the conventional explanation offered today.
But the downturn in the euro started a week ago well before the CPI data was in the public domain. Once again, the market makes the news!
That downturn actually started from a target area that I had pencilled in weeks ago purely from a review of Fibonacci levels and an application of basic Elliott wave theory.
Predicting turns without even knowing the bigger picture
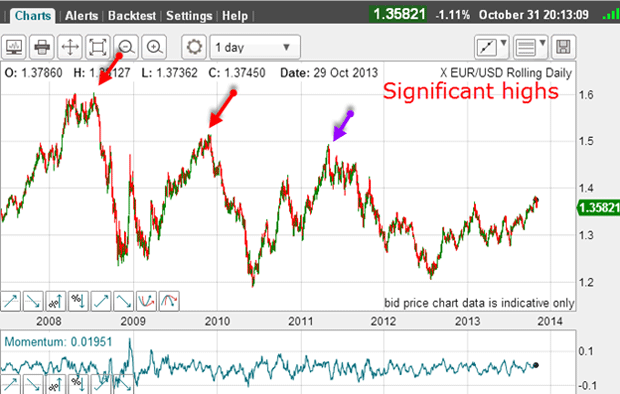
There have been many huge swings, both up and down. From the most recent significant low in July 2012, the market has rallied to last week's high at the 1.38 level.
Prior to that, the most recent significant high was that marked by the blue arrow.
So those are the most significant pivot points for applying the Fibonacci levels.
Let's do that:
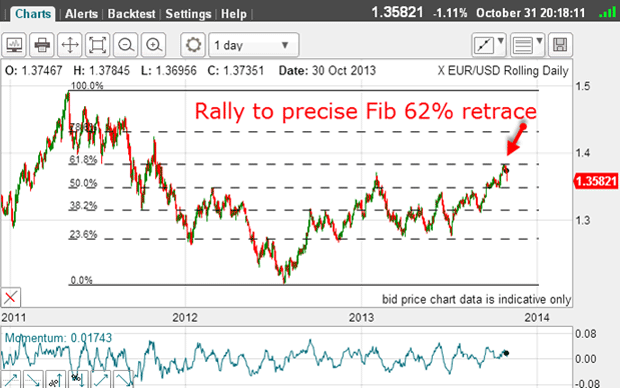
Right away, we see the rally has carried to the precise Fibonacci 62% retrace of that large move down. This is highly significant.
Recall that retracements turn around more at the 50% and 62% levels than from any other Fibonacci level. And this one fits perfectly.
So, even without knowing a thing about the macro-economic picture, you can say that a turn here is highly likely.
I find that, more often than not, the Fibonacci levels mark at least a pause in the trend, so that a low-risk trade can be put on. And if the retreat off that level reverses and the main trend carries the market above the Fibonacci level, at least you have the opportunity to move your stop to break-even and suffer no loss.
Timing is everything
But that is not all let's examine the rally off last summer's low:
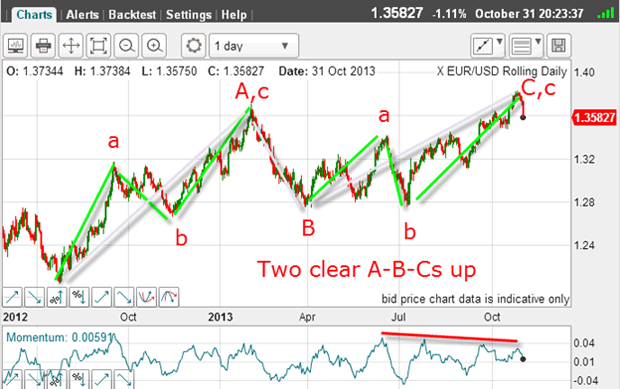
The rally is in two stages: a smaller a-b-c within a larger A wave and anothera-b-c within the large C wave.
At last week's high, there is a clear negative-momentum divergence. This is an indication that the buying was getting weaker.
And these momentum divergences are warning signs for a probable turn ahead.
But it is the nature of this advance in clear three-wave forms that points to the entire rally being counter-trend. With this knowledge, you know the relief rally will be running out of steam at some point and the main downtrend will resume.
This means that traders should be looking to abandon any long trades and position short. But as ever, timing is crucial and that is where my tramline method comes into its own.
An ideal place for the market to turn
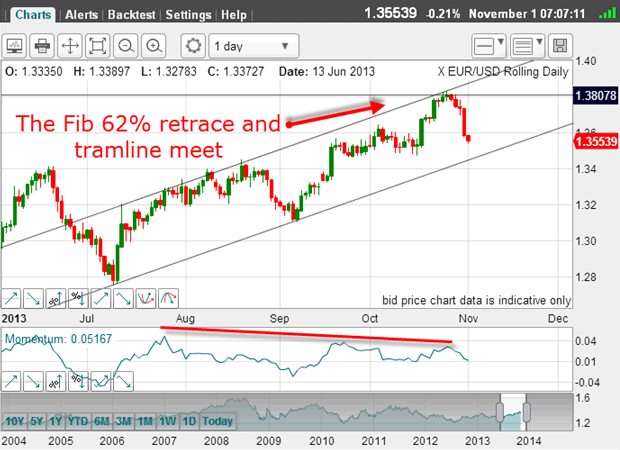
When the September low was put in, I could draw my lower tramline off the July low. My upper tramline was then easy I ran it across the July-August highs and projected it into the future months.
And last week, the market made a thrust up to where the upper tramline meets the Fibonacci retrace an area of very stiff resistance.
If the market was going to turn, that would be the ideal place especially given the looming negative-momentum divergence!
What more does a trader want for a signal to short this market?
Taking a contrarian approach can pay off
That was the strong belief. And was why the euro was pushed to such giddy heights but it was also the reason any decline was likely to be vicious.
The other factor, the US dollar, was under pressure because of the dual fiascos of the government shut-down and the debt ceiling fight.
And that is where a contrarian approach really pays off.
To give me a sell signal, I followed the progress of the new up-sloping tramline on this close-up:
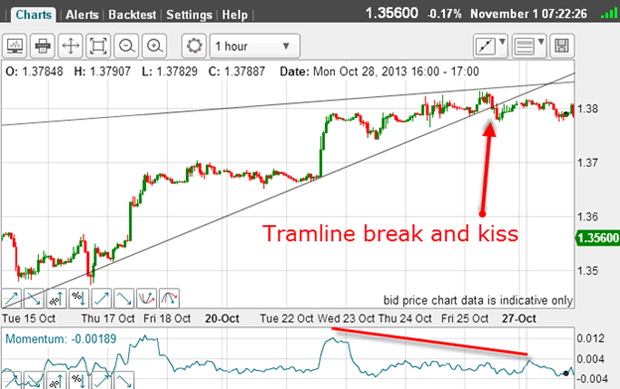
And last Friday, I got what I was looking for a tramline break. That was the first sign of a turn-around.
Following the break, the market attempted a farewell kiss on the underside of the tramline, and then gradually peeled away.
There were two clear points of entry presented. And a clear stop-loss level (above the recent high).
The Elliott roadmap
Here is the picture this morning:
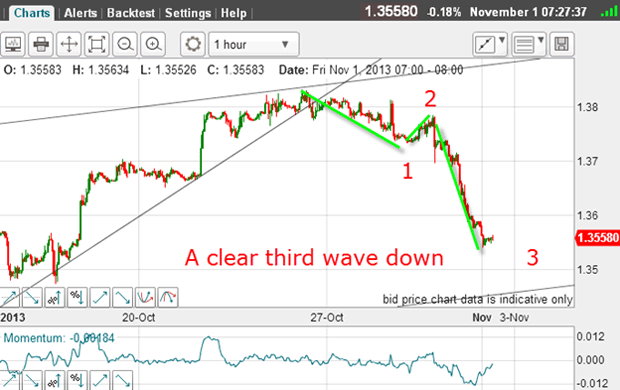
The market has cascaded down by almost 300 pips, in a clear (uncompleted) Elliott wave pattern. My third wave is long and strong (observe the low momentum reading). And when it ends, there should be a wave 4 up leading to a new low in wave 5.
The alternative view is that the decline is an A-B-C, indicating a correction to the main uptrend started in July. But that is less likely, for the reasons I gave above.
So this is the roadmap that Elliott provides, and it is very clear. As the market progresses, you will know whether it is following it or not. We know what to expect.
And if the market follows it, then traders can use the rally in wave 4 to position short, if they wish.
But if the market chooses to ignore this map, you will know about it right away and can take evasive action.
The long-term forecast
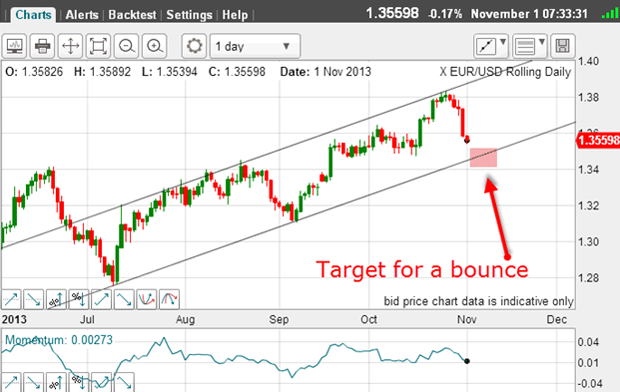
Here are my longer-term tramlines, which show that the market is gunning for the lower line.
This is where the wave 3 or wave 5 could end, and from where a large bounce could ensue.
Seeing a clear five-wave decline in place would cement the bearish view. This is because an impulsive five wave move signals that the main trend is in the direction of that pattern.
And the lower tramline would be a place where short-term profits could be taken for a very tasty 300 to 400-pip profit.
But for now, it appears the downtrend has resumed and the money will be in trading short.
This is a textbook example of how to trade using Fibonacci, Elliott waves and tramlines together.
Get the latest financial news, insights and expert analysis from our award-winning MoneyWeek team, to help you understand what really matters when it comes to your finances.
John is is a British-born lapsed PhD physicist, who previously worked for Nasa on the Mars exploration team. He is a former commodity trading advisor with the US Commodities Futures Trading Commission, and worked in a boutique futures house in California in the 1980s.
He was a partner in one of the first futures newsletter advisory services, based in Washington DC, specialising in pork bellies and currencies. John is primarily a chart-reading trader, having cut his trading teeth in the days before PCs.
As well as his work in the financial world, he has launched, run and sold several 'real' businesses producing 'real' products.
-
 Average UK house price reaches £300,000 for first time, Halifax says
While the average house price has topped £300k, regional disparities still remain, Halifax finds.
-
 Barings Emerging Europe trust bounces back from Russia woes
Barings Emerging Europe trust has added the Middle East and Africa to its mandate, delivering a strong recovery, says Max King