This will be my last post this week. I shall be speaking at the London Money Show on Friday and will be back in on Monday.
For this post, I will analyse the chart of a stock I follow Goldman Sachs (NYSE) and go through the process I use when I go over a chart for a possible trade.
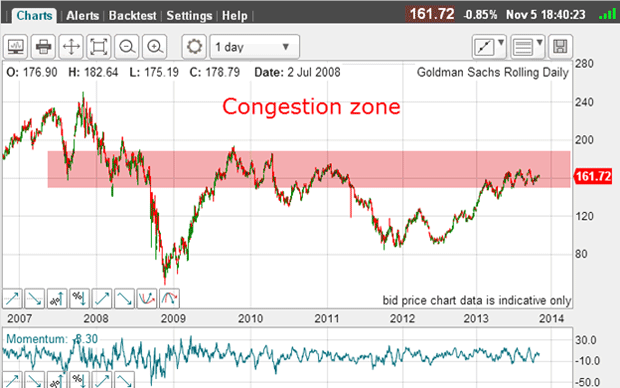
This is the daily chart going back to the pre-2008 Credit Crunch days:
Try 6 free issues of MoneyWeek today
Get unparalleled financial insight, analysis and expert opinion you can profit from.

Sign up to Money Morning
Don't miss the latest investment and personal finances news, market analysis, plus money-saving tips with our free twice-daily newsletter
Don't miss the latest investment and personal finances news, market analysis, plus money-saving tips with our free twice-daily newsletter
The waves are complex and there are no obvious Elliott wave patterns that I can see.

But with the market in the 160 area, it has rallied along with the general market - in a zig-zag fashion up to an area where there is much congestion.
A congestion zone is a band of prices where there has been much trading in the past. This means there are many positions taken in this zone both long and short. And many of these positions are still held today.
Congestions zones: where thwarted buyers sell
So, when the market rallies back into the zone and reaches a price where those stale bulls can escape, they will sell to avoid the pain of seeing that price possibly disappear. Also, they wish to re-deploy their capital into what they consider more fruitful sectors.
They are anxious to escape with little or no loss.
This produces selling pressure when the market enters this zone and you can see that several rallies have been turned back from this zone.
That is why I always look for possible turns when a market enters a congestion zone.
So that is the background I will be working with looking for a possible turn down.
The next task is to focus on the latest swing and see if I can apply a good tramline pair:
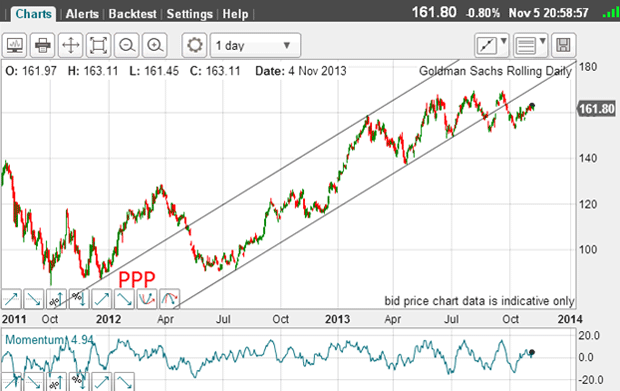
And here is a very good set of tramlines.
My upper one has the important prior pivot point (PPP) and the major February high as a touch point.
My lower line is a little more impressive with at least four accurate touch points which lie solidly on the line.
This is a tramline pair that encompasses almost two years. Trading has been confined to this channel for many months.
And then in September, we had a breakdown through the lower line of support. The market then staged a rally back inside the trading channel and then broke back below the lower line once more.
Currently, the market is attempting to get back to this line as it tries for a kiss.
Let's zero in on the latest action:
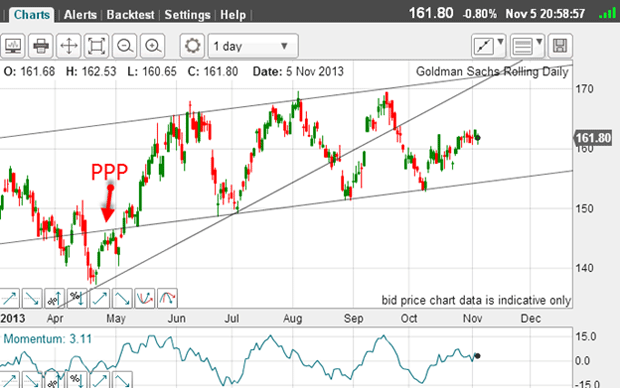
I can draw a new tramline pair with the lower tramline having several great touch points and an excellent PPP.
This more recent tramline pair is more current than the original and I will give it precedence.
For the upper line, I have cut off the two pigtails to give three good touch points.
Remember, I am looking for a possible turn down.
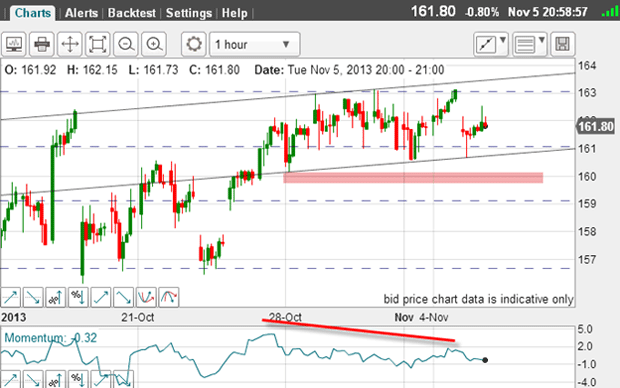
So let's zero in some more:
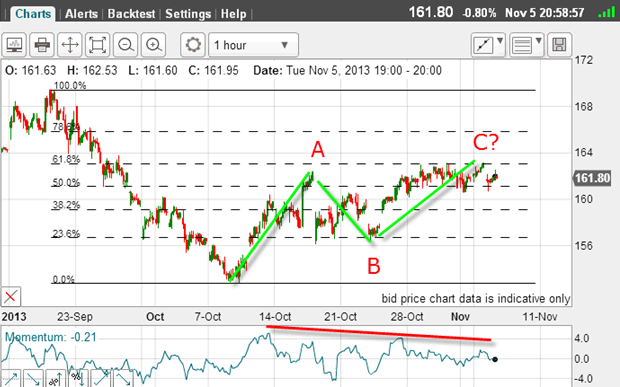
This is the hourly chart of the swing down off the 19 September high to the 9 October low and the corrective rally.
I say corrective because it is clearly in an A-B-C form. All A-B-C patterns are corrective to the main trend. Also, there is a large negative-momentum divergence working a sign that the buying power is drying up.
Therefore, the A-B-C is telling me that the main trend is resuming.
Fibonacci lines are like rubber bands
So, the evidence is piling up that we could have a turn at this 62% level.
Yesterday, the market opened on a gap down. This confirms that the 62% level, which the market reached on Monday, represents very strong resistance.
Think of the Fibonacci levels as a line that repels the market. This line is made of rubber. Sometimes the rubber is very taut, and the market fails to get beyond the exact level and turns back.
And sometimes the rubber is slacker, where the market pushes somewhat beyond the level before snapping back. This is when you find an overshoot of the exact Fibonacci level. It appears on the chart often as a pigtail.
So let us focus even closer:
I have another tramline pair where both have excellent touch points. And I have a negative-momentum divergence working.
Also, the market has made several hits on the Fibonacci 62% resistance level and in every case it has been turned back.
Isn't it remarkable that Fibonacci levels can be so precise as to be able to repel the market many times to within pips of the line? Remember, these levels are drawn from the most recent major high and low made many days ago. Markets have memories!
Use chart resistance to make low risk trades
But the most important point is that with the line of resistance given by the Fibonacci 62% level, I have a clear strategy for the placement of my protective stop just above the line.
Remember, I am only interested in low-risk trades.
So my methodical analysis has given me a logical place to enter a short trade and a logical place to enter my stop for a low-risk trade within my 3% rule. This is a complete trading system.
In fact, it is possible to limit my risk to less than 3% of my account because of the precision of the Fibonacci line of resistance a most welcome event.
Even if this trade is a loser, it will not impact my account significantly. If the market punches through the 62% level, the next stop is the 78% level, which would be another excellent place to look for a short trade.
These are the kinds of trades I search for with high probability and at low risk.
They are out there!