How COT data decodes the markets
Sentiment data can give you a huge hint as to which way the market is heading, says John C Burford. Here, he looks at the gold, euro and Dow markets to explain how.
Get the latest financial news, insights and expert analysis from our award-winning MoneyWeek team, to help you understand what really matters when it comes to your finances.
You are now subscribed
Your newsletter sign-up was successful
Want to add more newsletters?

Twice daily
MoneyWeek
Get the latest financial news, insights and expert analysis from our award-winning MoneyWeek team, to help you understand what really matters when it comes to your finances.

Four times a week
Look After My Bills
Sign up to our free money-saving newsletter, filled with the latest news and expert advice to help you find the best tips and deals for managing your bills. Start saving today!
th { background: #2b1083; padding: 2px 1px;color: white;font-weight: bold;text-align: center;border-left: 1px solid #a6a6c9; font-size: .8em;}
th.first { border-left: 0; padding: 2px 1px;text-align: left; font-size: .8em;}
tr {background: #fff;}
MoneyWeek
Subscribe to MoneyWeek today and get your first six magazine issues absolutely FREE

Sign up to Money Morning
Don't miss the latest investment and personal finances news, market analysis, plus money-saving tips with our free twice-daily newsletter
Don't miss the latest investment and personal finances news, market analysis, plus money-saving tips with our free twice-daily newsletter
tr.alt {background: #f6f5f9; }
td { padding: 2px 1px;text-align: center;border-left: 1px solid #a6a6c9;color: #000;vertical-align: center; font-size: .8em;}
td.alt { background-color: #f6f5f9; }
td.bold { font-weight: bold;}
td.first { text-align: left; }
td.left { text-align: left; }
td.bleft{ text-align: left; font-weight: bold; }-->An attendee at the MoneyWeek conference on Friday asked me why I put so much emphasis on market sentiment. I answered that "trading is not so much trying to figure out where I think the market is going, but discovering where others think it is going".
That about sums up what I try to do in my trading, and in my posts.
In other words, if I can correctly guess where the other traders are heading before they make their move, I am ahead of the game. My own views on where I think the market should be heading do not matter, because if I am swimming against the tide, I will lose. There is no consolation prize for being proven right, after suffering a heavy loss.
This is the essence of correct timing.
What COT told us about gold, euro and the Dow
The COT data shows the distribution of futures positions amongst the various groups: the large specs (primarily hedge funds); the commercials (the trade); and small specs.
Another important point to keep in mind is that during a solid trend, say a bull trend, the overwhelming proportion of longs will be accumulated by the specs and vice versa. You will see a general build-up of long positions by the specs.
At some point, the trend changes to down and then there will start a process of long liquidation so that at the major lows, the overwhelming percentage of shorts will be held by the specs.
Every bull market sows the seeds of its own destruction.
Therefore, when you see in a long bull market a large percentage (and growing) of longs in the hands of the specs, you know that a trend change may well be at hand.
In this way, I pay particular attention to changes during the past week, which I always highlight in yellow. These changes can give subtle clues as to the ebb or flow of the tide of money.
And last week we had several terrific examples in gold, currencies and stocks of what the COT data can show us, if we read it correctly.
Gold
| OPEN INTEREST: 443,806 | ||||||||
| COMMITMENTS | ||||||||
| 186,921 | 103,195 | 25,713 | 190,502 | 274,648 | 403,136 | 403,556 | 40,670 | 40,250 |
| CHANGES FROM 05/07/13 (CHANGE IN OPEN INTEREST: 5,875) | ||||||||
| -2,422 | 3,275 | 1,862 | 3,831 | 258 | 3,271 | 5,395 | 2,604 | 480 |
| PERCENT OF OPEN INTEREST FOR EACH CATEGORY OF TRADERS | ||||||||
| 42.1 | 23.3 | 5.8 | 42.9 | 61.9 | 90.8 | 90.9 | 9.2 | 9.1 |
| NUMBER OF TRADERS IN EACH CATEGORY (TOTAL TRADERS: 319) | ||||||||
| 131 | 102 | 70 | 61 | 59 | 222 | 208 | Row 8 - Cell 7 | Row 8 - Cell 8 |
Also, the small specs are buying the dip' as they add to their long positions by 5%.
To me this is a very small change in positions given the size of the price fall, and also that fall comes off a high near $1,480 at the start of May.
My reading: the specs still are reluctant to give up on their long gold trades, and many are even buying more gold.
So what does this mean for the market? Since Tuesday, the market has fallen even further, and the specs are being tested even more.
In gold, as in many other markets, major lows are only put in when there has been a general surrender, or capitulation' on high trading volumes. As of last Tuesday, the specs are still holding a large long position and the key point is that this is the fuel for further price declines.
If I had seen a large sell-out by the specs in the data, then a low was very likely near. I just cannot make that conclusion from the data.
But if next Friday's report shows a substantial liquidation of long positions by the specs, that could change the picture, and a low might be close.
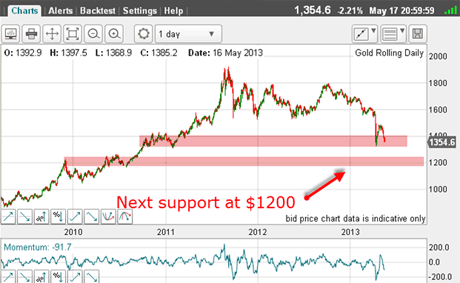
Here is the daily gold chart:

(Click on the chart for a larger version)
Note that the bounce off the $1,320 level last month started from the chart support from mid-2011.
The next chart support is in the $1,200 region. If the specs continue to stick stubbornly to their positions, that target will likely be met.
I always look for areas of long-term chart support as possible targets for price swings.
Euro
| OPEN INTEREST: 232,417 | ||||||||
| COMMITMENTS | ||||||||
| 52,843 | 99,764 | 6,696 | 132,700 | 65,854 | 192,239 | 172,314 | 40,178 | 60,103 |
| CHANGES FROM05/07/13 (CHANGE IN OPEN INTEREST: 17,820) | ||||||||
| 326 | 13,714 | 802 | 17,554 | -3,176 | 18,682 | 11,340 | -862 | 6,480 |
| PERCENT OF OPEN INTEREST FOR EACH CATEGORY OF TRADERS | ||||||||
| 22.7 | 42.9 | 2.9 | 57.1 | 28.3 | 82.7 | 74.1 | 17.3 | 25.9 |
| NUMBER OF TRADERS IN EACH CATEGORY (TOTAL TRADERS: 171) | ||||||||
| 29 | 73 | 28 | 41 | 41 | 87 | 125 | Row 8 - Cell 7 | Row 8 - Cell 8 |
Also, the small specs joined the party by adding to their bearish positions.
My reading: This is neutral for the market. But with more a more bearish position by the specs, this sets up the likelihood of a major bounce soon.

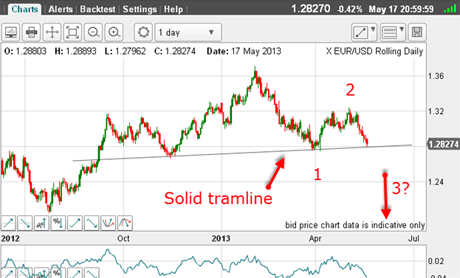
(Click on the chart for a larger version)
On Friday, the market has touched the major tramline. A solid break would set up the Elliott wave labels as marked, with a major third wave underway, which are long and strong. But because this line has held before, it would take a huge effort to punch below it without further work.
To verify the third wave, the market needs to keep its rapid descent going.
Dow
| OPEN INTEREST: 119,758 | ||||||||
| COMMITMENTS | ||||||||
| 45,139 | 9,530 | 395 | 55,521 | 89,468 | 101,055 | 99,393 | 18,703 | 20,365 |
| CHANGES FROM05/07/13 (CHANGE IN OPEN INTEREST: -602) | ||||||||
| -2,385 | -359 | 372 | 503 | -2,292 | -1,510 | -2,279 | 908 | 1,677 |
| PERCENT OF OPEN INTEREST FOR EACH CATEGORY OF TRADERS | ||||||||
| 37.7 | 8.0 | 0.3 | 46.4 | 74.7 | 84.4 | 83.0 | 15.6 | 17.0 |
| NUMBER OF TRADERS IN EACH CATEGORY (TOTAL TRADERS: 110) | ||||||||
| 36 | 14 | 4 | 38 | 31 | 74 | 49 | Row 8 - Cell 7 | Row 8 - Cell 8 |
The hedgies are almost five-to-one bullish, although slightly less so during the week when the market was making new all-time highs almost daily.
My reading: Yes, I may sound like a cracked record, but the end of the rally off the 2009 lows is getting closer by the day. And note the small specs are much more equivocal than the large specs as they hold about equal numbers of longs and shorts. They have a much less rosy view as they operate in the real economy.
Here is an interesting thought:

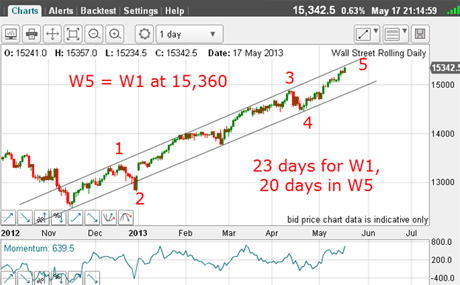
(Click on the chart for a larger version)
This is the clear five-wave structure off the November low, which is following my tramlines with one head fake for the second wave.
One of the common features of five-wave patterns is for equality in price between the first and fifth wave. This places the fifth wave top target in the 15,360 region, which it hit on Friday.
If there is equality in the waves in terms of price, why not equality in terms of time duration of the one and five waves?
So if the fifth wave lasts as long as the first wave, and has the same price jump, the turn could come between now and mid-week - since the first wave took 23 days to play out.
We shall know pretty soon if this intriguing scenario is correct.
If you're a new reader, or need a reminder about some of the methods I refer to in my trades, then do have a look at my introductory videos:
The essentials of tramline trading Advanced tramline trading An introduction to Elliott wave theory Advanced trading with Elliott waves Trading with Fibonacci levels Trading with 'momentum' Putting it all together
Don't miss my next trading insight. To receive all my spread betting blog posts by email, as soon as I've written them, just sign up here . If you have any queries regarding MoneyWeek Trader, please contact us here.
Get the latest financial news, insights and expert analysis from our award-winning MoneyWeek team, to help you understand what really matters when it comes to your finances.
John is is a British-born lapsed PhD physicist, who previously worked for Nasa on the Mars exploration team. He is a former commodity trading advisor with the US Commodities Futures Trading Commission, and worked in a boutique futures house in California in the 1980s.
He was a partner in one of the first futures newsletter advisory services, based in Washington DC, specialising in pork bellies and currencies. John is primarily a chart-reading trader, having cut his trading teeth in the days before PCs.
As well as his work in the financial world, he has launched, run and sold several 'real' businesses producing 'real' products.
-
 Can mining stocks deliver golden gains?
With gold and silver prices having outperformed the stock markets last year, mining stocks can be an effective, if volatile, means of gaining exposure
-
 8 ways the ‘sandwich generation’ can protect wealth
People squeezed between caring for ageing parents and adult children or younger grandchildren – known as the ‘sandwich generation’ – are at risk of neglecting their own financial planning. Here’s how to protect yourself and your loved ones’ wealth.