How to trade a euphoric market
Such extreme bullish sentiment in US stocks is a gift to swing traders, says John C Burford. Here, he employs his charting methods as he goes in search of the market-top.
Get the latest financial news, insights and expert analysis from our award-winning MoneyWeek team, to help you understand what really matters when it comes to your finances.
You are now subscribed
Your newsletter sign-up was successful
Want to add more newsletters?

Twice daily
MoneyWeek
Get the latest financial news, insights and expert analysis from our award-winning MoneyWeek team, to help you understand what really matters when it comes to your finances.

Four times a week
Look After My Bills
Sign up to our free money-saving newsletter, filled with the latest news and expert advice to help you find the best tips and deals for managing your bills. Start saving today!
Today, I will cover the US equity markets via the S&P 500 index, which has been making new all-time highs of late.
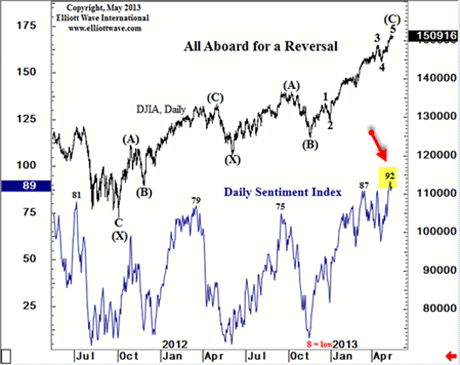
Euphoria is rampant in the stock market there is no other word for it. Sentiment readings are almost off-the-scale bullish. Here is just one:

Source: www.elliottwave.com
MoneyWeek
Subscribe to MoneyWeek today and get your first six magazine issues absolutely FREE

Sign up to Money Morning
Don't miss the latest investment and personal finances news, market analysis, plus money-saving tips with our free twice-daily newsletter
Don't miss the latest investment and personal finances news, market analysis, plus money-saving tips with our free twice-daily newsletter
The Daily Sentiment Index is a poll of futures traders, and since the start of the year, record highs have been continually made.
But note that back at the November low, only 8% of the market was bullish! Now, there are only 8% bears. That is extraordinary.
So, in the space of six months, traders have swung 180 degrees to the bull camp. You may ask what causes a herd of traders to switch allegiance so suddenly?
A great question! And one that many have answers for although most are plain wrong! My view is that traders follow the herd, albeit mostly unconsciously. Where the herd is heading, that's where most follow. Waves of sentiment/mood sweep humanity. When people become more positive, they tend to buy stocks, and vice versa.
And when hedge fund managers see others buying, they are literally forced to follow suit, despite any reservations they have. Otherwise, they will be accused of not matching or beating their competitors. This fear is the motivation behind herding. Also, the US Fed has been vigorous in their support for the market, of course.
But there is another powerful factor at play in the current market Tina.
There Is No Alternative that is the prime justification for buying stocks in 2013. Let's look at a few of those alternatives:
Bond yields are puny even junk bonds are making new all-time highs, despite the risk that is why they are called junk. Even sovereign bonds of such problem nations as Italy, Greece and Spain are being pushed up, supposedly from the waves of investment from Japan.
Gold does not have the allure it once did, and commodities are well off their highs and appear unattractive.
And once the darling of investors, emerging markets have declined off their highs.
So, US stock markets and junk bonds, which act very much like equities are almost the only major area which attracts investors. And since recent company earnings have been good, that has provided the justification for joining the herd.
But Tina is not an investment strategy it is a frame of mind. If equities are the lesser of several evils, then they are still evil! And frames of mind can change overnight (see above chart).
One other point some are calling this the start of a massive bull market with some forecasts calling for 25,000 in the Dow.
But one glance at the above chart should convince that we are much closer to a top than a bottom. All bottoms have started from low bullish readings, and all tops have been made on high bullishness. In fact, this has to be the case.
The power to create a bull market has to come first from the majority of traders/investors that have not yet bought into the market, then from the majority who are short, who need to cover as the market rallies.
This means that I am still looking for a top a search which has been in vain, I admit. Who said that markets can remain irrational for longer than you can remain solvent? But maybe he hadn't heard of stop losses...
Could this be our top?
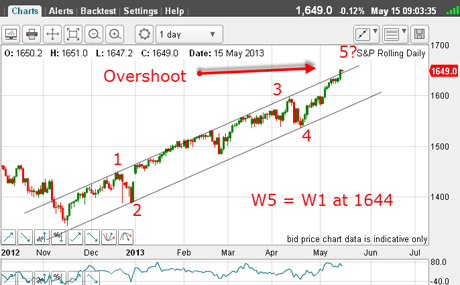
This is the daily S&P chart. The S&P 500 is regarded as the most representative market for US shares, whereas the Dow comprises only30 of the largest cap issues.

(Click on the chart for a larger version)
I have applied my Elliott wave labels to the rally off the November low. Remember, this was when there were only 8% bulls, and so is a complete bull run when the fifth wave ends, as it must!
I have drawn in my tramlines, which I regard as being excellent and reliable.
One very common wave relationship is the equality of the waves 1 and 5, so that if this holds here, the top should come around the 1,644 area and we are trading above this level this morning.
One other point yesterday's poke above the upper tramline would be an overshoot if the market retreats. Overshoots are excellent predictors for trend reversals. This morning, we have that overshoot above the 1,644 level.
The bottom line is this: the key for a turn here is for the market to quickly retreat back into the trading channel.
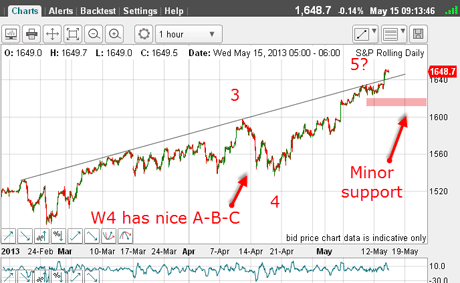
This means we must now zoom in on the hourly chart:

(Click on the chart for a larger version)
Note that W4 sported a clear A-B-C, which is corrective, meaning that the major trend was still up then.
The potential overshoot shows up clearly above my tramline. A move back down into the minor support area would very likely confirm the top.
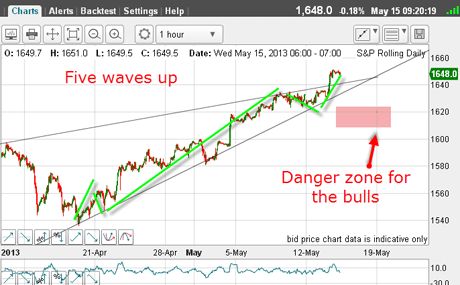
Taking an even closer look at the fifth wave:

(Click on the chart for a larger version)
I can count five clear waves within this fifth wave (green bars)! The third wave is long and strong, as required.
And I have a nice lower trendline, which completes a rising wedge formation off the 21 April low.
And we know that rising wedges almost always resolve downwards.
So, as I see it this morning, the market is highly likely to be on the verge of a decline, which should be vigorous, given the miniscule (8%) cohort of bears.
Finally, someone once said: "When everyone thinks the same, then no-one is thinking."
If you're a new reader, or need a reminder about some of the methods I refer to in my trades, then do have a look at my introductory videos:
The essentials of tramline trading Advanced tramline trading An introduction to Elliott wave theory Advanced trading with Elliott waves Trading with Fibonacci levels Trading with 'momentum' Putting it all together
Don't miss my next trading insight. To receive all my spread betting blog posts by email, as soon as I've written them, just sign up here . If you have any queries regarding MoneyWeek Trader, please contact us here.
Get the latest financial news, insights and expert analysis from our award-winning MoneyWeek team, to help you understand what really matters when it comes to your finances.
John is is a British-born lapsed PhD physicist, who previously worked for Nasa on the Mars exploration team. He is a former commodity trading advisor with the US Commodities Futures Trading Commission, and worked in a boutique futures house in California in the 1980s.
He was a partner in one of the first futures newsletter advisory services, based in Washington DC, specialising in pork bellies and currencies. John is primarily a chart-reading trader, having cut his trading teeth in the days before PCs.
As well as his work in the financial world, he has launched, run and sold several 'real' businesses producing 'real' products.
-
 Should you buy an active ETF?
ETFs are often mischaracterised as passive products, but they can be a convenient way to add active management to your portfolio
-
 Power up your pension before 5 April – easy ways to save before the tax year end
With the end of the tax year looming, pension savers currently have a window to review and maximise what’s going into their retirement funds – we look at how