Hedge funds turn bearish on the gold price
Far from being the lone predators of popular imagination, hedge funds herd together, says John C Burford - a telling indicator for chart-following traders.
Get the latest financial news, insights and expert analysis from our award-winning MoneyWeek team, to help you understand what really matters when it comes to your finances.
You are now subscribed
Your newsletter sign-up was successful
Want to add more newsletters?

Twice daily
MoneyWeek
Get the latest financial news, insights and expert analysis from our award-winning MoneyWeek team, to help you understand what really matters when it comes to your finances.

Four times a week
Look After My Bills
Sign up to our free money-saving newsletter, filled with the latest news and expert advice to help you find the best tips and deals for managing your bills. Start saving today!
On Friday, I suggested that, because trader sentiment has turned very bearish towards gold, we may see a decent counter-trend rally sometime soon.
I realise this would disappoint the army of gold bears, who believe gold is heading for the $1,000 level and beyond.
This may occur in time, but the market usually has a way of delaying nirvana for a group of traders that have suddenly jumped over to the opposite camp.
MoneyWeek
Subscribe to MoneyWeek today and get your first six magazine issues absolutely FREE

Sign up to Money Morning
Don't miss the latest investment and personal finances news, market analysis, plus money-saving tips with our free twice-daily newsletter
Don't miss the latest investment and personal finances news, market analysis, plus money-saving tips with our free twice-daily newsletter
According to the latest commitments of traders (COT) data, the switch has been striking:
| (Contracts of 100 Troy ounces) | Row 0 - Cell 1 | Row 0 - Cell 2 | Row 0 - Cell 3 | Open interest: 403,840 | ||||
| Commitments | ||||||||
| 144,062 | 82,710 | 29,266 | 190,317 | 256,102 | 363,645 | 368,078 | 40,195 | 35,762 |
| Changes from 11/05/13 (Change in open interest: 17,044) | ||||||||
| -4,969 | 24,815 | 5,614 | 11,603 | -16,512 | 12,248 | 13,917 | 4,796 | 3,127 |
| Percent of open in terest for each category of traders | ||||||||
| 35.7 | 20.5 | 7.2 | 47.1 | 63.4 | 90.0 | 91.1 | 10.0 | 8.9 |
| Number of traders in each category (Total traders: 289) | ||||||||
| 102 | 94 | 74 | 58 | 60 | 203 | 197 | Row 8 - Cell 7 | Row 8 - Cell 8 |
The stunning change in sentiment
Hedge funds are, contrary to popular opinion, big herders and group together in the same way as individual small traders.
That is a stunning switch of sentiment no doubt helped along by Goldman Sachs' forecast in September that gold could clearly trade below $1,000, which I quoted in Friday's post.
This is in addition to the latest DSI (daily sentiment index) reading of only 10% bulls among trading advisers.
Also note the position of the commercials generally regarded as the smart money who have swung net bullish.
Keeping your options open

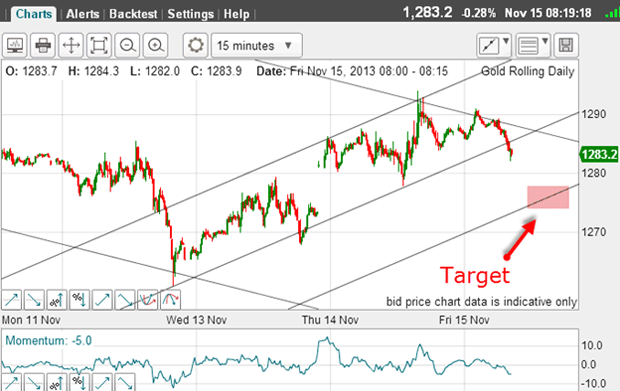
I wasn't entirely happy with them, because of the large overshoot on Wednesday. And when you are not convinced that your tramlines are secure, it pays to keep your options open until more highs and lows are put in.
Then, when you can find more precise touch points, you may need to make adjustments, as I did here.
This proved to be true on Friday.
The decline progressed later that day and hit a new low at $1,280, just short of my above target.
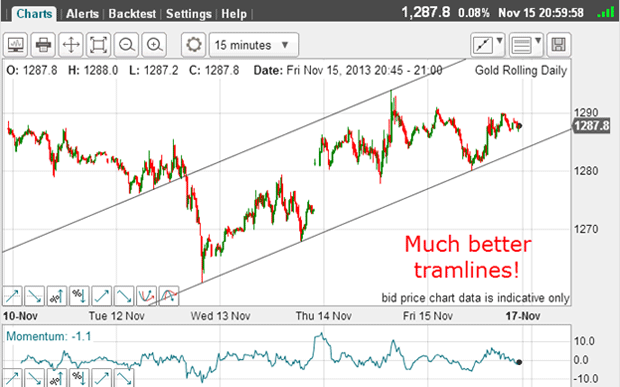
And that allowed me to try that low as a touch point. This was the result:

That's better! Now just admire the lower tramline first it lies across all three lows and hits them right on the nose in all three cases.
And my new upper tramline takes in the one touch point and has the multiple PPPs (prior pivot points).
Now I have a very reliable tramline pair which will guide my trading.
Be prepared to redraw your tramlines
This is something you must be prepared to do as trading develops and gives you new highs and lows.
And since the new low was a Fibonacci 38% retrace of the entire rally, that gave added weight to my new tramlines. This is because the $1,280 low has good Fibonacci support, as well as the support provided by the new tramline.
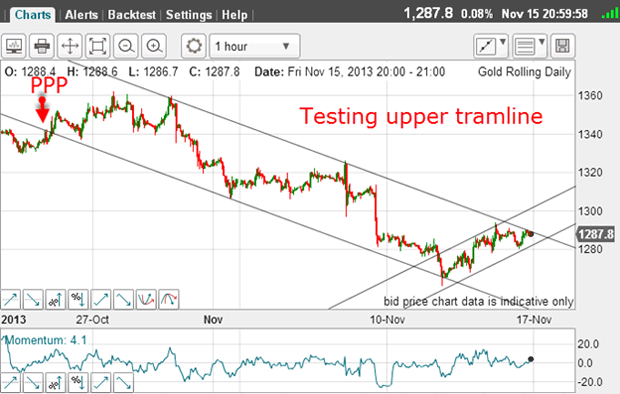
So, how are we placed now with respect to the down-sloping, longer-term tramline?

Again, I have slightly re-drawn the down-sloping tramlines and the market is currently testing the upper one.
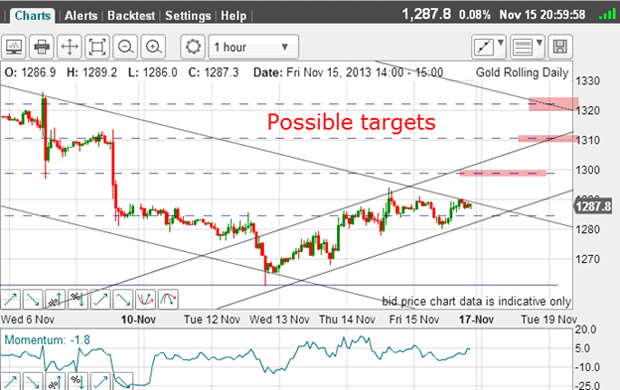
If it can break up through it, then where is my likely first target?
At the upper up-sloping tramline in the $1,300 - $1,310 area.
The safest strategy for novice traders

So, provided the market can break above the $1,290 area, the next Fibonacci targets are shown in pink.
And remember, a crossing of a tramline with a Fibonacci level makes especially strong resistance.
But at this stage, any rally will be counter to the main trend. This means any long trades need to be watched carefully because the main downtrend could resume at any time.
This is much more dangerous than trading with the main trend, of course. I do not generally advise a counter-trend strategy for novice traders.
The safest strategy is to trade in the direction of the main trend, with entry near the end of a counter-trend move (the example of EUR/USD in my 11 November post is a good one).
Get the latest financial news, insights and expert analysis from our award-winning MoneyWeek team, to help you understand what really matters when it comes to your finances.
John is is a British-born lapsed PhD physicist, who previously worked for Nasa on the Mars exploration team. He is a former commodity trading advisor with the US Commodities Futures Trading Commission, and worked in a boutique futures house in California in the 1980s.
He was a partner in one of the first futures newsletter advisory services, based in Washington DC, specialising in pork bellies and currencies. John is primarily a chart-reading trader, having cut his trading teeth in the days before PCs.
As well as his work in the financial world, he has launched, run and sold several 'real' businesses producing 'real' products.
-
 ISA fund and trust picks for every type of investor – which could work for you?
Whether you’re an ISA investor seeking reliable returns, looking to add a bit more risk to your portfolio or are new to investing, MoneyWeek asked the experts for funds and investment trusts you could consider in 2026
-
 The most popular fund sectors of 2025 as investor outflows continue
It was another difficult year for fund inflows but there are signs that investors are returning to the financial markets