Gold came under big pressure this week
The gold price hit John C Burford's recent target pretty much on the nose. Here he uses his tramline trading methods to forecast where it might be going next.
Get the latest financial news, insights and expert analysis from our award-winning MoneyWeek team, to help you understand what really matters when it comes to your finances.
You are now subscribed
Your newsletter sign-up was successful
Want to add more newsletters?

Twice daily
MoneyWeek
Get the latest financial news, insights and expert analysis from our award-winning MoneyWeek team, to help you understand what really matters when it comes to your finances.

Four times a week
Look After My Bills
Sign up to our free money-saving newsletter, filled with the latest news and expert advice to help you find the best tips and deals for managing your bills. Start saving today!
It has been a dramatic week for gold. When I last covered it on 14 November, the market was rallying in a relief move from the huge decline to the early November $1,670 low.
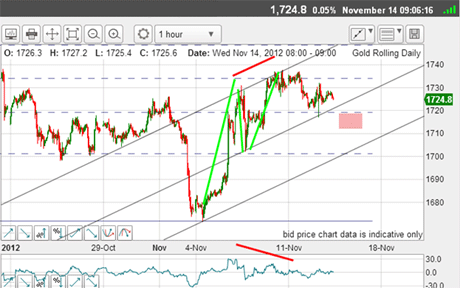
This was the picture then:
(Click on the chart for a larger version)
MoneyWeek
Subscribe to MoneyWeek today and get your first six magazine issues absolutely FREE

Sign up to Money Morning
Don't miss the latest investment and personal finances news, market analysis, plus money-saving tips with our free twice-daily newsletter
Don't miss the latest investment and personal finances news, market analysis, plus money-saving tips with our free twice-daily newsletter
The rally had then carried to the Fibonacci 50% retrace, had made an A-B-C form, and there was a negative momentum divergence. What more did I need to make that short trade?
The answer: A move below my tramline into the pink zone would do it!
But it was not to be. The market rallied from there in another lurch upwards. I was without a trade.
This is what I wrote on 14 November: "Of course, we could get another upward thrust from the centre tramline if it reaches it. The key here is if the market can rally above the most recent highs in the $1,730-$1,740 area. That would indicate the next target is the Fibonacci 62% level at $1,750."
And this is precisely what occurred as the market moved up to the $1,750 level. It is always satisfying when a forecast target is hit pretty much on the nose.
When the floodgates opened
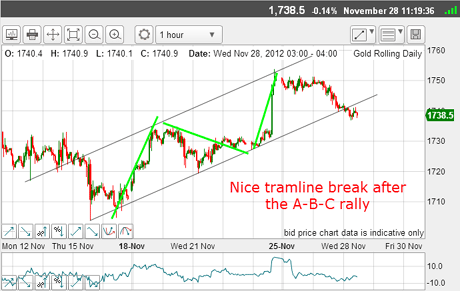
So with the rally to the $1,750 level, this was the picture on Wednesday:
(Click on the chart for a larger version)
I have a superb upper tramline with multi prior pivot point (PPP) anchor points and the push to a slight overshoot of $1,750 providing a good touch point.
Of course, before that event, I had my lower tramline drawn in already with its several excellent touch points.
But the rally could not hold, and the market fell back to the lower tramline on Wednesday and then proceeded to break below as it made a small kiss to its underside, and then the scalded cat bounce' down.
That was the signal for me to enter a short trade with protective stop at around the $1,750 region.
And then the floodgates opened with a waterfall break down to the $1,705 level within minutes. This is a hallmark of a change in trend from the relief rally to the resumption of the bear market.
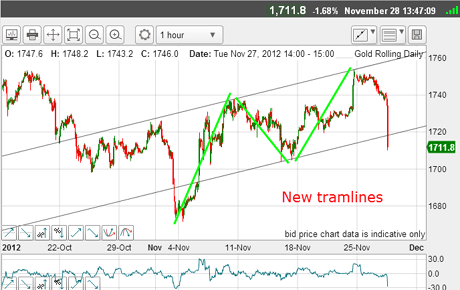
Many protective sell stops must have been triggered on this cascade. And this was the picture as I took the screenshot on Wednesday and as it neared the $1,700 level:
(Click on the chart for a larger version)
I was then able to draw in a new tramline pair albeit the lower one is very tentative, with only one touch point. But the upper one worked beautifully to turn the market at the $1,750 area. This is also the exact Fibonacci 62% retrace of the big move down off the 5 October $1,796 high and the 2 November $1,675 low another reason to look for a turn there.
This upper line has all the necessary assets from a solid PPP to catching the major tops along the way.
Once again, this is another great example of how to use my tramline methods.
Bullish sentiment on gold
During the previous rally, I noted a much more bullish tone to the gold articles and posts. Was this matched by the COT data?
Here is the latest data as of 20 November:
TABLE.ben-table TABLE {BORDER-BOTTOM: #2b1083 1px solid; BORDER-LEFT: #2b1083 1px solid; BORDER-TOP: #2b1083 1px solid; BORDER-RIGHT: #2b1083 1px solid}TH {TEXT-ALIGN: center; BORDER-LEFT: #a6a6c9 1px solid; PADDING-BOTTOM: 2px; PADDING-LEFT: 1px; PADDING-RIGHT: 1px; BACKGROUND: #2b1083; COLOR: white; FONT-SIZE: 0.8em; FONT-WEIGHT: bold; PADDING-TOP: 2px}TH.first {TEXT-ALIGN: left; BORDER-LEFT: 0px; PADDING-BOTTOM: 2px; PADDING-LEFT: 1px; PADDING-RIGHT: 1px; FONT-SIZE: 0.8em; PADDING-TOP: 2px}TR {BACKGROUND: #fff}TR.alt {BACKGROUND: #f6f5f9}TD {TEXT-ALIGN: center; BORDER-LEFT: #a6a6c9 1px solid; PADDING-BOTTOM: 2px; PADDING-LEFT: 1px; PADDING-RIGHT: 1px; COLOR: #000; FONT-SIZE: 0.8em; PADDING-TOP: 2px}TD.alt {BACKGROUND-COLOR: #f6f5f9}TD.bold {FONT-WEIGHT: bold}TH.date {FONT-SIZE: 0.7em}TD.first {TEXT-ALIGN: left}TD.left {TEXT-ALIGN: left}TD.bleft {TEXT-ALIGN: left; FONT-WEIGHT: bold}
| Contracts of 100 Troy ounces | Row 0 - Cell 1 | Row 0 - Cell 2 | Row 0 - Cell 3 | Open interest: 474,129 | ||||
| Commitments | ||||||||
| 217,433 | 36,618 | 38,921 | 145,098 | 381,162 | 401,452 | 456,701 | 72,677 | 17,428 |
| Changes from 13/11/12 (Change in open interest: 14,368) | ||||||||
| 9,586 | 365 | 5,597 | 610 | 11,879 | 15,793 | 17,841 | -1,425 | -3,473 |
| Percent of open in terest for each category of traders | ||||||||
| 45.9 | 7.7 | 8.2 | 30.6 | 80.4 | 84.7 | 96.3 | 15.3 | 3.7 |
| Number of traders in each category (Total traders: 354) | ||||||||
| 213 | 66 | 78 | 54 | 47 | 303 | 165 | Row 8 - Cell 7 | Row 8 - Cell 8 |
Indeed it was the large specs (hedge funds, ETFs) increased their already lop-sided bullish position by 9,500 contracts (about 4.5%) during the rally phase.
Interestingly, the small specs also had a net increase in bullish positions, as they lifted more shorts than longs. Hmm.
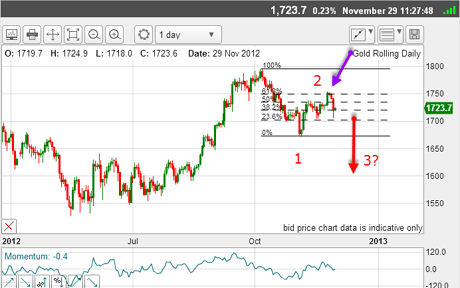
So let's go back to the big picture and see where we are on the daily chart:
(Click on the chart for a larger version)
The move off the $1,796 top to the $1,675 low is wave 1 down. The rally from October into this week is wave 2, which topped at the Fibonacci 62% retrace (purple arrow) and sports a lovely A-B-C pattern.
If this is correct, we are in a large third wave down which should take the market into the congestion zone from the summer which surrounds the $1,600 area.
That is the roadmap I shall be using until it is proved wrong (only by a rally above the $1,796 high).
But finally, back to the smaller scale and the minor Elliott waves. Here is the hourly chart again as of this morning:
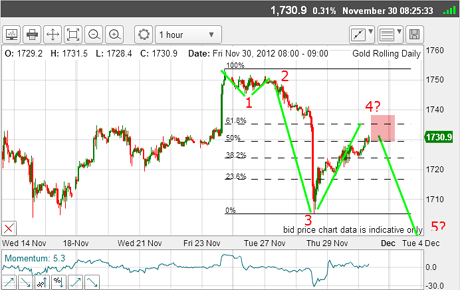
(Click on the chart for a larger version)
It looks as if we have wave 1 down, then wave 2 up. Then a huge wave 3 down (long and strong) and currently, we are in a wave 4 up which could end at the Fibonacci 50% - 62% retrace (pink zone), before moving to new lows in the fifth wave below major support at the $1700 area.
So it appears we are in a large third wave down and within this wave, we are working on a smaller five wave pattern.
The only fly that could spoil this ointment is for the market to rally above $1,750. That is my line in the sand for this wave interpretation. Also, any rally in this fourth wave must turn below the wave1 low, otherwise we would not have a genuine five-wave motive thrust to indicate the new trend is now down.
Meanwhile, I have moved my protective stop to break-even just in case.
I hope you see by this example how I use basic Elliott wave theory in my trading. I know many traders shy away from this theory as they view it as complex and arbitrary. But using its bare bones ideas can sometimes give vital clues of what to expect next. This is forecasting, and that is what we all have to do. And every little helps!
If you're a new reader, or need a reminder about some of the methods I refer to in my trades, then do have a look at my introductory videos:
The essentials of tramline trading
An introduction to Elliott wave theory
Advanced trading with Elliott waves
Don't miss my next trading insight. To receive all my spread betting blog posts by email, as soon as I've written them, just sign up here . If you have any queries regarding MoneyWeek Trader, please contact us here.
Get the latest financial news, insights and expert analysis from our award-winning MoneyWeek team, to help you understand what really matters when it comes to your finances.
John is is a British-born lapsed PhD physicist, who previously worked for Nasa on the Mars exploration team. He is a former commodity trading advisor with the US Commodities Futures Trading Commission, and worked in a boutique futures house in California in the 1980s.
He was a partner in one of the first futures newsletter advisory services, based in Washington DC, specialising in pork bellies and currencies. John is primarily a chart-reading trader, having cut his trading teeth in the days before PCs.
As well as his work in the financial world, he has launched, run and sold several 'real' businesses producing 'real' products.
-
 Japanese stocks rise on Takaichi’s snap election landslide
Japan’s new prime minister Sanae Takaichi has won a landslide victory in a snap election, prompting optimism that her pro-growth agenda will benefit Japanese stocks
-
 Alphabet 'is planning a 100-year bond': would you back Google for 100 years?
Google owner Alphabet is reported to be joining the rare century bond club