The trouble with gold
John C Burford explains what gold's erratic movements in the charts can tell traders about where the market is heading next.
Get the latest financial news, insights and expert analysis from our award-winning MoneyWeek team, to help you understand what really matters when it comes to your finances.
You are now subscribed
Your newsletter sign-up was successful
Want to add more newsletters?

Twice daily
MoneyWeek
Get the latest financial news, insights and expert analysis from our award-winning MoneyWeek team, to help you understand what really matters when it comes to your finances.

Four times a week
Look After My Bills
Sign up to our free money-saving newsletter, filled with the latest news and expert advice to help you find the best tips and deals for managing your bills. Start saving today!
I follow the gold story today because it is a perfect example of how to use my tramline concept. It gives you a roadmap of likely support, resistance and target zones all invaluable information.
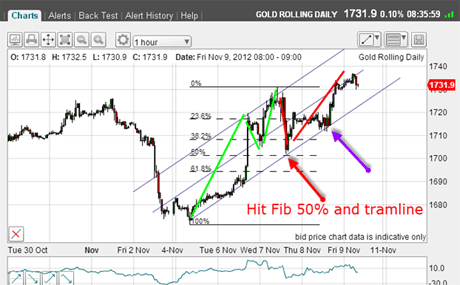
In my Fridaypost, I had a long trade working. It was based on a lower tramline touch (see the below chart).
The most recent touch of the lower tramline was the opportunity for me to take a long trade using a close stop just below the tramline. I was encouraged by the previous big sell-off, which was reversed at the tramline and helped establish its position.
MoneyWeek
Subscribe to MoneyWeek today and get your first six magazine issues absolutely FREE

Sign up to Money Morning
Don't miss the latest investment and personal finances news, market analysis, plus money-saving tips with our free twice-daily newsletter
Don't miss the latest investment and personal finances news, market analysis, plus money-saving tips with our free twice-daily newsletter

(Click on the chart for a larger version)
And on Friday, the market was running up the centre line right into the crucial 50% Fibonacci retrace of the big move down from the $1,796 high.
That was reason enough for me to take the profit and watch from the sidelines.
OK, how does the picture look this morning?

(Click on the chart for a larger version)
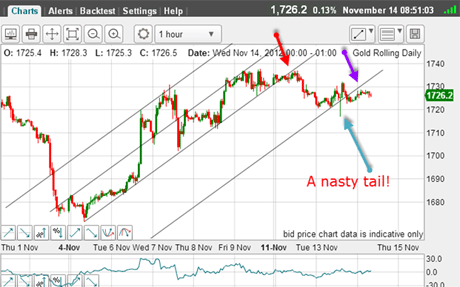
On Friday, the market broke away from the centre tramline and headed for my original lower tramline and then broke for the new lowest tramline in the $1,720 area, where it found support.
That was reassuring, as it confirmed this tramline placement.
I believed that a break of this tramline would signal the resumption of the bear market. But I hadn't reckoned on gold's nasty habit of spiking down through a tramline and then back up, leaving a rat's tail on the candlestick.
My short sale just under $1,720 looked good for a few minutes but then the snap-back hit my protective stop for a small loss. That almost cancelled out the previous gain on the long trade.
That, I'm afraid, is the price for swing trading gold.
Another short opportunity?
But the interesting feature of this chart is the behaviour of the market after a tramline break. In each case (red and purple arrows), the market has come back to kiss the underside of the line before peeling away.
At the red arrow, the kiss was an opportunity to enter a short trade at low risk.
Here we are at the purple arrow is this a similar opportunity?
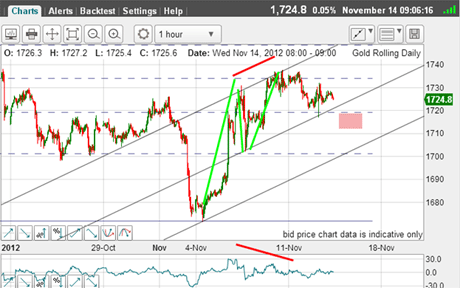
Let's back up and see if I can find another tramline set that could guide my thinking. Here is the hourly chart again showing the big rally off the early November low:

(Click on the chart for a larger version)
The two big features staring us in the face is the clear A-B-C form to the rally (green bars) and the big negative momentum divergence between waves A and C.
Trader tip: Look out for momentum divergences between pairs of highs and lows. A divergence means the move is running out of puff and often leads to a swift reversal where you can jump on board.
It is starting to look glum for the bulls here! The key to the resumption of the move down is for the market to reach the pink zone after a centre tramline break.
Will this occur?
Of course, we could get another upward thrust from the centre tramline if it reaches it. The key here is if the market can rally above the most recent highs in the $1,730-1,740 area. That would indicate the next target is the Fibonacci 62% level at $1,750.
One of these scenarios will likely play out over the next few days, I am quite sure.
If you're a new reader, or need a reminder about some of the methods I refer to in my trades, then do have a look at my introductory videos:
The essentials of tramline trading
An introduction to Elliott wave theory
Advanced trading with Elliott waves
Don't miss my next trading insight. To receive all my spread betting blog posts by email, as soon as I've written them, just sign up here . If you have any queries regarding MoneyWeek Trader, please contact us here.
Get the latest financial news, insights and expert analysis from our award-winning MoneyWeek team, to help you understand what really matters when it comes to your finances.
John is is a British-born lapsed PhD physicist, who previously worked for Nasa on the Mars exploration team. He is a former commodity trading advisor with the US Commodities Futures Trading Commission, and worked in a boutique futures house in California in the 1980s.
He was a partner in one of the first futures newsletter advisory services, based in Washington DC, specialising in pork bellies and currencies. John is primarily a chart-reading trader, having cut his trading teeth in the days before PCs.
As well as his work in the financial world, he has launched, run and sold several 'real' businesses producing 'real' products.
-
 Average UK house price reaches £300,000 for first time, Halifax says
While the average house price has topped £300k, regional disparities still remain, Halifax finds.
-
 Barings Emerging Europe trust bounces back from Russia woes
Barings Emerging Europe trust has added the Middle East and Africa to its mandate, delivering a strong recovery, says Max King