Finding the price path of least resistance
The euro market is looking very polarised at the moment. Which side will be proved right? John C Burford looks to the charts to find out.
Get the latest financial news, insights and expert analysis from our award-winning MoneyWeek team, to help you understand what really matters when it comes to your finances.
You are now subscribed
Your newsletter sign-up was successful
Want to add more newsletters?

Twice daily
MoneyWeek
Get the latest financial news, insights and expert analysis from our award-winning MoneyWeek team, to help you understand what really matters when it comes to your finances.

Four times a week
Look After My Bills
Sign up to our free money-saving newsletter, filled with the latest news and expert advice to help you find the best tips and deals for managing your bills. Start saving today!
A number of people have asked me to cover the euro since I last looked at that market on 10 October. Today's a great time to look at it, since there's some really tremendous tramline work to show. As good students of my methods, I am sure many of you have been trading the euro with similar tramlines.
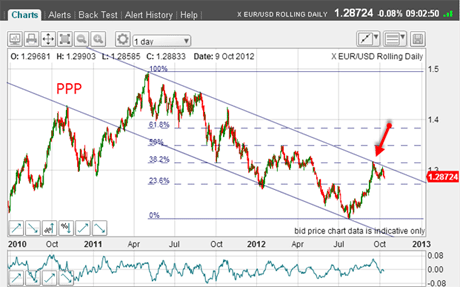
Let me back up to over a month ago and recap the situation on the daily chart:

(Click on the chart for a larger version)
MoneyWeek
Subscribe to MoneyWeek today and get your first six magazine issues absolutely FREE

Sign up to Money Morning
Don't miss the latest investment and personal finances news, market analysis, plus money-saving tips with our free twice-daily newsletter
Don't miss the latest investment and personal finances news, market analysis, plus money-saving tips with our free twice-daily newsletter
The market had bounced off the 1.20 low on 24 July into the 1.32 mid-September high. That was a huge 1,200-pip move which encouraged the hedge funds to take a massive gamble against the dollar (I had a pin-up chart showing the sudden switch in net-long to net-short futures positions of the hedge funds, which I encouraged readers to study).
Over the following days, the market backed and filled around the 1.30 level and since then, has been trending lower to the current 1.27 area.
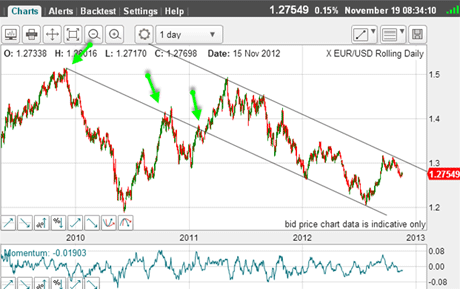
With that topping process in September/October, I was able to draw my upper tramline in a better position:

(Click on the chart for a larger version)
Not only that, but my lower tramline sports three excellent prior pivot points (PPPs). I believe I can rely heavily on these lines as support and resistance levels.
Now I have a clear picture of where we are in the current market between tramlines and closer to the upper one.
OK, the question is: is there a sensible trade at current levels?
A possible A-B-C pattern
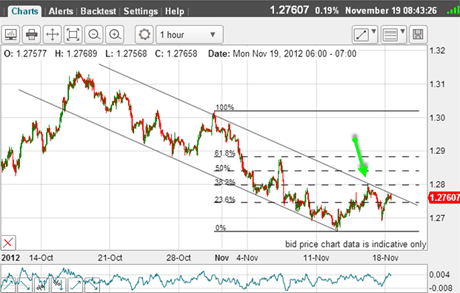
It's time to look at the hourly chart:

(Click on the chart for a larger version)
I have a super lower tramline with many touch points. That's good. But the upper one is less than perfect with onlytwo to threetouch points. It is much less reliable than the lower one.
But the market is testing this upper line as I write. A punch up through would be interesting!
And note that last Thursday's 1.28 high (green arrow) stopped right at the Fibonacci 38% retrace of the move down from the most significant recent high near 1.29.
Now if the market can push above the Thursday high, that would set up a likely A-B-C pattern and lead to a probable resumption of the downtrend.
Where could this rally turn? The natural place to start looking is at the Fibonacci 50% or 62% area.
Now this is really getting interesting!
Hedgies short, small traders long
Now let's see if the latest commitments of traders (COT) data can shed any light on changes in sentiment:
| OPEN INTEREST: 231,660 | ||||||||
| COMMITMENTS | ||||||||
| 39,863 | 123,509 | 2,568 | 150,428 | 48,432 | 192,859 | 174,509 | 38,801 | 57,151 |
| CHANGES FROM 11/06/12 (CHANGE IN OPEN INTEREST: 3,935) | ||||||||
| -5,349 | 11,156 | -104 | 7,237 | -6,432 | 1,784 | 4,620 | 2,151 | -685 |
| PERCENT OF OPEN INTEREST FOR EACH CATEGORY OF TRADERS | ||||||||
| 17.2 | 53.3 | 1.1 | 64.9 | 20.9 | 83.3 | 75.3 | 16.7 | 24.7 |
| NUMBER OF TRADERS IN EACH CATEGORY (TOTAL TRADERS: 172) | ||||||||
| 33 | 59 | 16 | 52 | 52 | 95 | 117 | Row 8 - Cell 7 | Row 8 - Cell 8 |
The hedge funds are still net short by a large margin of over three-to-one, but our ally, the small trader, is net long by about 1.5to-one.
But note the changes on the week. The hedge funds have swung to a more bearish position, while the small traders have become more bullish.
How's that for a polarised market? I believe it highlights the heavily entrenched positions of the two camps. On the bullish side, the belief is that Germany will be forced to continue bankrolling the debts of countries such as Greece, Portugal and Spain, thereby delaying any decision on euro membership.
For the bears, the calculation is that eurozone break-up is inevitable, EU exports are declining, and interest rates will stay on the floor.
As a swing trader, I am agnostic on these matters. My job is to try to find the price path of least resistance and trade it accordingly.
My view is that there is more reward in exploiting weakness in whatever direction than in holding a quasi-religious view on what should' occur in the eurozone.
The question of Britain's EU membership has moved on to the front burner, and I read much public comment on this topic, much of which is highly charged (with anger). Again, this is yet another manifestation of the deep cracks opening up in society, which is being mirrored in the markets.
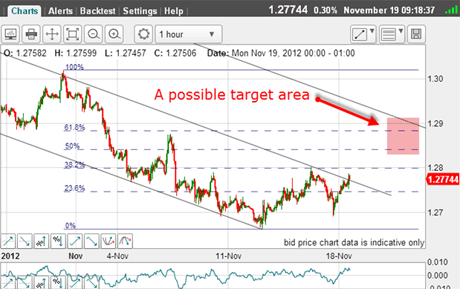
Let's see what the possible targets are if this rally can expand:

(Click onthe chartfor alarger version)
I have drawn in my third upper tramline and highlighted the Fibonacci 50-62% zone in pink.
This new tramline in the 1.29 area seems distant and any rally here would make my A-B-C pattern very lop-sided with an extended C wave. Hmmm.
I am reluctant to take a long trade if the market can move higher from here because of the limited upside, as I see it.
The bottom line is that I shall remain sitting on my hands until I see a clear signal to pounce again and that could come sooner rather than later!
If you're a new reader, or need a reminder about some of the methods I refer to in my trades, then do have a look at my introductory videos:
The essentials of tramline trading
An introduction to Elliott wave theory
Advanced trading with Elliott waves
Don't miss my next trading insight. To receive all my spread betting blog posts by email, as soon as I've written them, just sign up here . If you have any queries regarding MoneyWeek Trader, please contact us here.
Get the latest financial news, insights and expert analysis from our award-winning MoneyWeek team, to help you understand what really matters when it comes to your finances.
John is is a British-born lapsed PhD physicist, who previously worked for Nasa on the Mars exploration team. He is a former commodity trading advisor with the US Commodities Futures Trading Commission, and worked in a boutique futures house in California in the 1980s.
He was a partner in one of the first futures newsletter advisory services, based in Washington DC, specialising in pork bellies and currencies. John is primarily a chart-reading trader, having cut his trading teeth in the days before PCs.
As well as his work in the financial world, he has launched, run and sold several 'real' businesses producing 'real' products.
-
 Average UK house price reaches £300,000 for first time, Halifax says
While the average house price has topped £300k, regional disparities still remain, Halifax finds.
-
 Barings Emerging Europe trust bounces back from Russia woes
Barings Emerging Europe trust has added the Middle East and Africa to its mandate, delivering a strong recovery, says Max King