The euro resumes its decline
With the euro in a long-term downtrend, it's safest to trade from the short side, says John C Burford. Here, he uses his trading methods to find a low-risk entry point.
Get the latest financial news, insights and expert analysis from our award-winning MoneyWeek team, to help you understand what really matters when it comes to your finances.
You are now subscribed
Your newsletter sign-up was successful
Want to add more newsletters?

Twice daily
MoneyWeek
Get the latest financial news, insights and expert analysis from our award-winning MoneyWeek team, to help you understand what really matters when it comes to your finances.

Four times a week
Look After My Bills
Sign up to our free money-saving newsletter, filled with the latest news and expert advice to help you find the best tips and deals for managing your bills. Start saving today!
Gazing at my trading screen this morning, I am spoiled for choice as to today's topic. Many of the tramlines I have been working with in many markets were violated yesterday in large sell-offs and I will cover these later this week and next.
But I believe the euro offers some terrific examples of how my methods can help identify excellent trade entries and the exits can wait!
Anyone studying the currency markets will quickly learn that when a long-term trend gets going, it is like the Duracell bunny - it keeps going on and on and on.
MoneyWeek
Subscribe to MoneyWeek today and get your first six magazine issues absolutely FREE

Sign up to Money Morning
Don't miss the latest investment and personal finances news, market analysis, plus money-saving tips with our free twice-daily newsletter
Don't miss the latest investment and personal finances news, market analysis, plus money-saving tips with our free twice-daily newsletter
We are in a well-established down trend in the EUR/USD. That much is clear from just a glance at the weekly chart. So the only sensible medium-to-long-term stance is to trade from the short side.
That is not to say there will not be large counter-trend rallies, as we have seen recently. But I believe the safest and surest way to make profits and avoid losses is to trade with the larger trend, especially in currencies.
But one of the biggest problems is deciding when a rally is likely to run out of steam and a low-risk short trade can be entered.
As you know, I like to use Fibonacci in identifying likely reversal zones and recent action in the euro has been a solid case in point.
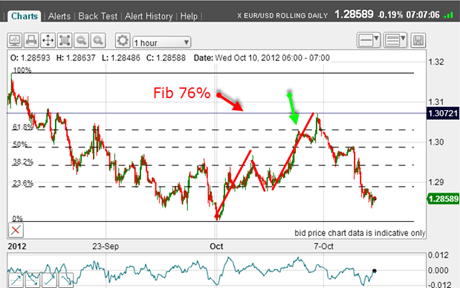
Here is the hourly chart:
(Click on the chart for a larger version)
The market low at 1.28 on 1 October was followed by a sharp rally just when the market was heavily bearish. In other words, speculators large and small had amassed a huge net short position.
As we all know by now, this is exactly what it takes to lay the ground for a short squeeze of some size. More on this point later
Trader tip: Keep an eye on sentiment and COT data for signs of extremes of imbalance, especially today when extremes exist in many of the major markets. I wrote of the imbalance in gold yesterday.
I have drawn the A-B-C wave pattern to this rally. The A wave overshot the Fibonacci 38% level, then retreated to wave B which was in the region of the 23% level, please note and rallied strongly to the 62% level (green arrow).
The 62% retrace is an excellent place to look for a short entry, and that would have been a good trade.
But the market is full of surprises. It fooled me by extending the rally to the Fibonacci 76% level, and perhaps stopping this trade out.
Trade tip: I know many traders have great difficulty when stopped out in getting back in, but that was the correct strategy, particularly when you see a negative momentum divergence at the high (see red arrows on next chart if you cannot spot it).
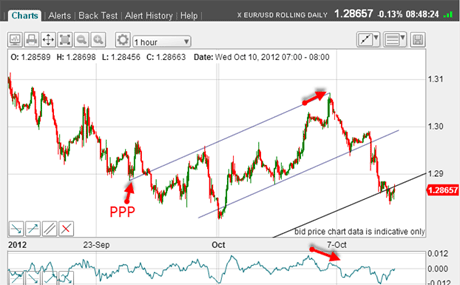
So now the market is heading back down, where are the likely areas of support? At the tramlines, of course. Here is the chart:
(Click on the chart for a larger version)
When the market made its Friday high, I could draw in my upper tramline, and gratifyingly, it has a solid prior pivot point(PPP).
My second tramline drew itself (the centre one here), despite the first touch-point being in an overshoot. This is typical behaviour after a sharp down move.
Bouncing back to October's retrace
Yesterday the market crashed through this centre line, and another short entry was presented.
This morning the market is jiggling around my third tramline, which not coincidentally is the Fibonacci 76% retrace of the October rally! Why not check for yourself?
With this support, I expect at least some degree of bounce. But if not forthcoming, new lows beckon below 1.28.
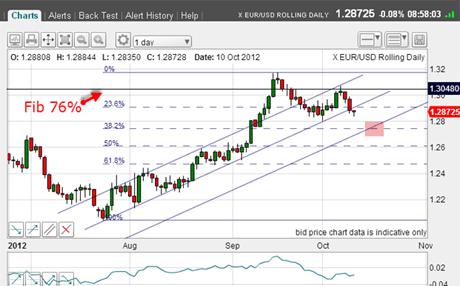
To check on the big picture always a good policy here is the daily chart showing my tramlines:
(Click on the chart for a larger version)
The Friday rally carried right to the Fibonacci 76% retrace! Another great reason to look for a short there.
With the centre tramline break, my first minor target is the meeting of the Fibonacci 38% level and the lowest tramline.
That would be a sensible place for short-term traders to look to take profits.
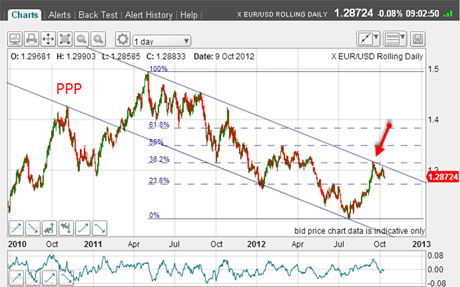
And on an even larger scale:
(Click on the chart for a larger version)
I have my very long-term tramlines with the upper one drawn off last June's 1.50 high. We hit it again mid-September (red arrow).
Very long-term, a sensible target would be the lower tramline in the 1.10-1.20 area.
And to wrap up, if you are trading currencies, this chart should be on your wall, preferably taking up most of it:
Hedgies hate the dollar
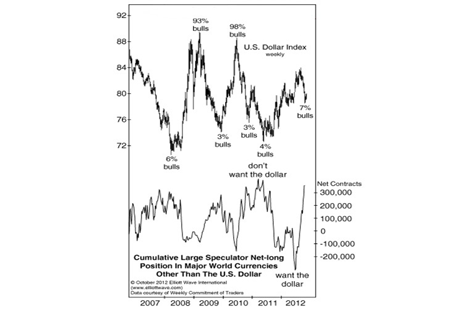
(Chart courtesy elliottwave.com. Click on the chart for a larger version)
As I discussed at the workshops last week, sentiment is what ultimately drives all markets and there is no finer proof of this than inthe chart.
Note that the major market turns coincide with sentiment extremes.
Take time to study it. I hope you will be convinced that the currency markets (speculators) are dangerously lop-sided against the US dollar with only 7% bulls and a near-record short futures position.
I was amazed to see the recent vertical rise from massively net short to massively net long currencies vs the dollar. I hope you are too.
Of course, the hedge funds have bought into the story that the Fed, through its 'QE infinity' (and beyond?) pledge, will destroy the dollar's value and rampant inflation will result.
But hedge fund managers are nothing if not bandwagon-jumpers. If they see a market rallying, they will justify their buying with rational analysis. If they see a market falling, they will come up with equally sensible and opposite reasons. Provided, of course, that their colleagues are doing the same!
With one eye on their bonuses, they talk their book and less sophisticated traders take all this seriously. Big mistake!
Do your own analysis from the mass of data freely available. Use simple charting methods such as those I am showing you. And you will stand every chanceof becoming an ace trader.
If you're a new reader, or need a reminder about some of the methods I refer to in my trades, then do have a look at my introductory videos:
The essentials of tramline trading
An introduction to Elliott wave theory
Advanced trading with Elliott waves
Don't miss my next trading insight. To receive all my spread betting blog posts by email, as soon as I've written them, just sign up here . If you have any queries regarding MoneyWeek Trader, please contact us here.
Get the latest financial news, insights and expert analysis from our award-winning MoneyWeek team, to help you understand what really matters when it comes to your finances.
John is is a British-born lapsed PhD physicist, who previously worked for Nasa on the Mars exploration team. He is a former commodity trading advisor with the US Commodities Futures Trading Commission, and worked in a boutique futures house in California in the 1980s.
He was a partner in one of the first futures newsletter advisory services, based in Washington DC, specialising in pork bellies and currencies. John is primarily a chart-reading trader, having cut his trading teeth in the days before PCs.
As well as his work in the financial world, he has launched, run and sold several 'real' businesses producing 'real' products.
-
 ISA fund and trust picks for every type of investor – which could work for you?
Whether you’re an ISA investor seeking reliable returns, looking to add a bit more risk to your portfolio or are new to investing, MoneyWeek asked the experts for funds and investment trusts you could consider in 2026
-
 The most popular fund sectors of 2025 as investor outflows continue
It was another difficult year for fund inflows but there are signs that investors are returning to the financial markets