This Dow ‘wedge’ is making me nervous
A rare example of an 'expanding wedge' in the Dow Jones makes John C Burford nervous - so is the stage set for another assault on the highs?
Get the latest financial news, insights and expert analysis from our award-winning MoneyWeek team, to help you understand what really matters when it comes to your finances.
You are now subscribed
Your newsletter sign-up was successful
Want to add more newsletters?

Twice daily
MoneyWeek
Get the latest financial news, insights and expert analysis from our award-winning MoneyWeek team, to help you understand what really matters when it comes to your finances.

Four times a week
Look After My Bills
Sign up to our free money-saving newsletter, filled with the latest news and expert advice to help you find the best tips and deals for managing your bills. Start saving today!
On Friday, markets retreated in powerful selling waves. This afternoon, I want to show how this has affected the Dow. This picture is mixed, to say the least.
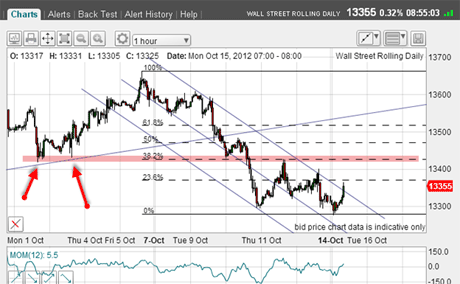
In my article on 15 October, I pointed out that the textbook Elliott wave patterns to the move off the 5 October 13,360 high was a clear indication that the trend had changed to down.
In that article (see: The Dow follows the script beautifully), I noted the likelihood of a rally starting that morning.
MoneyWeek
Subscribe to MoneyWeek today and get your first six magazine issues absolutely FREE

Sign up to Money Morning
Don't miss the latest investment and personal finances news, market analysis, plus money-saving tips with our free twice-daily newsletter
Don't miss the latest investment and personal finances news, market analysis, plus money-saving tips with our free twice-daily newsletter
The chart is reproduced below.
I had my first level of resistance at the pink bar.
So how did the rally progress?
Well, it sliced right up through my pink zone and headed for the upper reaches of the Fibonacci scale!
In fact, we had a lovely A-B-C with negative momentum divergence at the C wave high. And the C wave reached the Fibonacci 76% level.
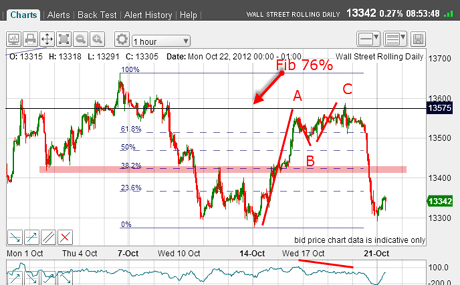
Time to look for a short trade!
Now, remember I have been regularly making the observation that the Dow has a reputation for making very deep upper retracements of its down-moves. And this is its latest manifestation.
A high probability, low risk trade
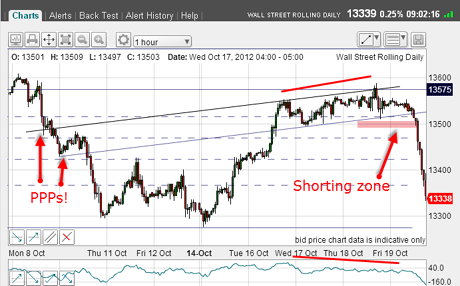
So how did I locate a sensible entry point? Here is a close-up of Friday's action:
(Click on the chart for a larger version)
I have drawn my short-term tramline pair using the excellent prior pivot points as anchor points for both lines.
Note that where my upper line intersects the Fibonacci 76% (horizontal) line, that was where I had a slight overshoot and then a pull-back into the trading channel. That was a clue that I had reached the rally top. The market was not comfortable above this area.
Then, setting a sell-stop order just below the lower tramline and also below the minor lows in the A-B-C sequence would be a high-probability, low-risk trade, and would catch the down-move if it was to occur.
So if the market had touched off my sell orders and then reversed upwards in a head fake', a protective stop inside the channel was a sensible strategy.
On Friday, the downward break was genuine and by the close, the market had fallen 180 pips or so beneath my entry. Nice trade!
Could we be in wave 3?
I like to keep an eye on the larger picture, so here is the updated daily chart I showed last time:
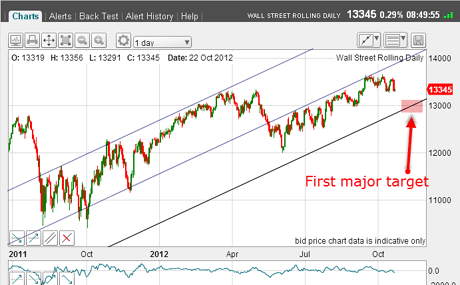
The market is rolling over away from my centre tramline and towards the lower line. My first major target remains the 13,000 area.
Let's have a look at the possible Elliott waves:
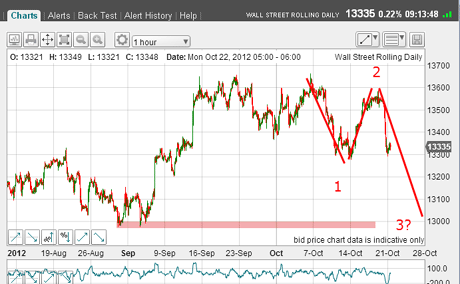
If the first wave down off the 5 October high is wave 1, and last week's deep upward retracement is wave 2, then we could well be in wave 3 down.
Confirmation would come if the 13,300 lows can be taken out and then rapid progress towards the next major low at 13,000 (my first major target, remember?).
Third waves are long and strong', so if we do have a third wave on our hands, rallies should be brief and declines large. That is what I will be looking for.
But what is the alternative scenario? After all, markets are probabilistic, anything is possible, but not everything is probable!
Here is one possibility:
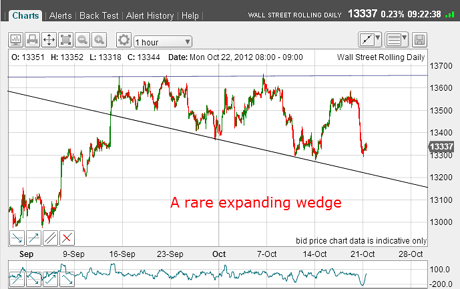
On this hourly chart, I can draw a rare example of an expanding wedge, where the lower line represents support. A rally back to the upper line can occur at any time.
So what could bring this about?
One possibility is that the Chinese and Japanese stock markets are now in rally mode! Check out the Nikkei and Shanghai or Hong Kong markets and you will see what I mean.
Also, the latest AAII report shows a growing bearish-leaning US public. This is potentially supportive to US stocks.
The question I have is this: has Friday's wash-out set the stage for another assault on the highs? It has taken out many weak longs are there many more left to shake out of the tree?
All of which means that I am a nervous Dow bear today!
If you're a new reader, or need a reminder about some of the methods I refer to in my trades, then do have a look at my introductory videos:
The essentials of tramline trading
An introduction to Elliott wave theory
Advanced trading with Elliott waves
Don't miss my next trading insight. To receive all my spread betting blog posts by email, as soon as I've written them, just sign up here . If you have any queries regarding MoneyWeek Trader, please contact us here.
Get the latest financial news, insights and expert analysis from our award-winning MoneyWeek team, to help you understand what really matters when it comes to your finances.
John is is a British-born lapsed PhD physicist, who previously worked for Nasa on the Mars exploration team. He is a former commodity trading advisor with the US Commodities Futures Trading Commission, and worked in a boutique futures house in California in the 1980s.
He was a partner in one of the first futures newsletter advisory services, based in Washington DC, specialising in pork bellies and currencies. John is primarily a chart-reading trader, having cut his trading teeth in the days before PCs.
As well as his work in the financial world, he has launched, run and sold several 'real' businesses producing 'real' products.
-
 Average UK house price reaches £300,000 for first time, Halifax says
While the average house price has topped £300k, regional disparities still remain, Halifax finds.
-
 Barings Emerging Europe trust bounces back from Russia woes
Barings Emerging Europe trust has added the Middle East and Africa to its mandate, delivering a strong recovery, says Max King