The Dow follows the script beautifully
The charts indicate that the moment of truth has arrived for the Dow bulls, says John C Burford. If the market slips now, it could have a long way to fall.
Get the latest financial news, insights and expert analysis from our award-winning MoneyWeek team, to help you understand what really matters when it comes to your finances.
You are now subscribed
Your newsletter sign-up was successful
Want to add more newsletters?

Twice daily
MoneyWeek
Get the latest financial news, insights and expert analysis from our award-winning MoneyWeek team, to help you understand what really matters when it comes to your finances.

Four times a week
Look After My Bills
Sign up to our free money-saving newsletter, filled with the latest news and expert advice to help you find the best tips and deals for managing your bills. Start saving today!
With my focus very much on gold and the euro recently, which are following their scripts, I have somewhat neglected my absolute favourite market the Dow (with S&P and NASDAQ running very close second and third). But today, I am making amends.
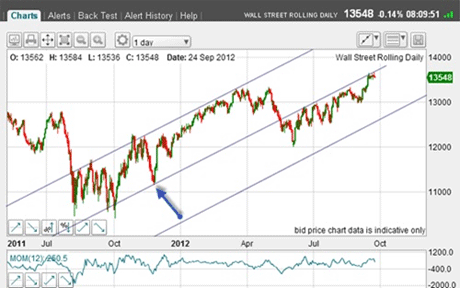
I last covered the Dow three weeks ago and the chart belowshows my long-term tramlines at the time.
I had a few anchor points for the centre tramline to choose from, but it appeared to me that the one chosen (theblue arrow) was the best. That's because the summer action respected that line with numerous touch-points, but crucially, there was no penetration above it.
MoneyWeek
Subscribe to MoneyWeek today and get your first six magazine issues absolutely FREE

Sign up to Money Morning
Don't miss the latest investment and personal finances news, market analysis, plus money-saving tips with our free twice-daily newsletter
Don't miss the latest investment and personal finances news, market analysis, plus money-saving tips with our free twice-daily newsletter
(Click on the chart for a larger version)
That was my line in the sand for taking a bearish stance.
My upper tramline also spotted many touch-points (with a slight overshoot almost exactly a year ago).
In that post, I made it plain that based on what I saw in the charts, I expected a top soon and then a vigorous move down. This was supported by the overweight long position of the hedge funds given by the COT data.
This view went against the prevailing very bullish outlook of the majority certainly of the professionals. The siren call of the Fed 'QE infinity' pledge for unlimited dollars has seduced many fund managers to jump on the bullish bandwagon just as it topples over!
So how is the Fed promise working out for these professionals?
(Click on the chart for a larger version)
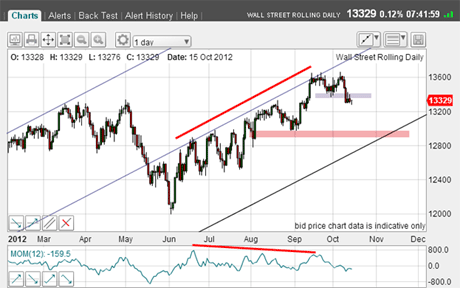
Oops! We had an initial rally to a new high at 13,660 on 5 October, but that was it the market has been in a solid downtrend since then under persistent selling.
How canit bethat with unlimited liquidity available, stocks and other asset markets are selling off? For instance, gold is down over $50 this morning from the 5 October high.
Yes, markets can be perverse, can't they? And that is why I advise traders to put aside their views and see what other traders are doing. Why? Because they have more firepower!
Back to the chart and note how momentum had been generally getting weaker during the big rally, indicating an unhealthy market. Something had to give.
And last week, the market made the break below the minor support (grey bar) and is currently eating into chart support.
My main target is now the major low made in early September (pink bar).
But what are the short-term tramlines saying?
(Click on the chart for a larger version)
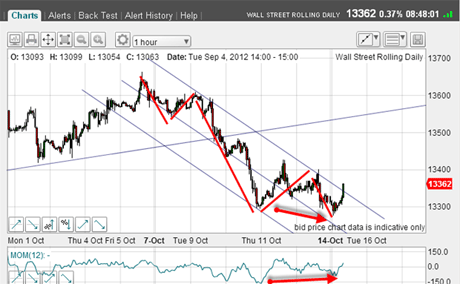
There is a nice five-wave move down off the 5 October high (red bars), and this indicates the trend has now changed to down. The fifth wave was made this morning in the overnight market. Note the third wave it is long and strong' and has five clear minor waves within.
That is very pretty and textbook Elliott wave theory.
But note the positive momentum divergence (red arrows) at the fifth wave low.
Ahoy there! Rally ahead!
As I write, I note the market has just moved up over my upper tramline. Now this tramline is not terribly secure. Why? Because I have few touch-points there and also the lowest one has only one with no prior pivot point(PPP). The centre line is better.
So I shall not be treating these tramlines as cast in stone.
OK, how high can the rally go? An extreme retrace would be back to the underside of the major tramline in the 13,550 area, of course. That would produce a kiss', hopefully followed by a scalded cat bounce down.
The Dow has a history of deep upward retracements, so I will not discount this out of hand.
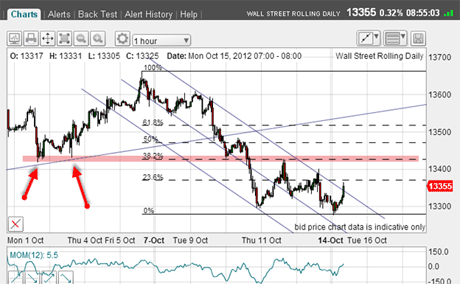
So now I have found a low this morning, I can apply my Fibonacci tool to give me likely areas of resistance:
(Click on the chart for a larger version)
A few moments ago, the market hit the 23% level and appears to be at least pausing here.
But if we get an A-B-C upward correction (my ideal scenario, as I never tire of saying!), a more likely target is the Fibonacci 38% level, where there lurks solid chart resistance at the pink bar. Note how this level has been both support (red arrows) and resistance.
If the market does reach the 38% level, it may trace out my A-B-C later today.
But to me, it appears increasingly sensible to trade the Dow from the short side.
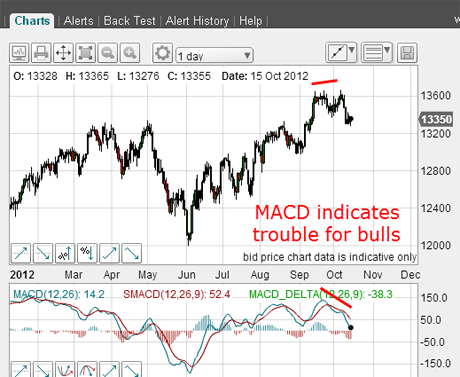
As an interesting aside, some traders follow the MACD indicator (explanation on all spread betting platforms or wiki). Here isits latest reading on the daily chart:
(Click on the chart for a larger version)
At high readings, when the short-term blue line crosses from above the long-term red line, that indicates a trend change. Observe the declining values at the 5 October 13,660 high. This was another confirmation that the bull market was living on borrowed time.
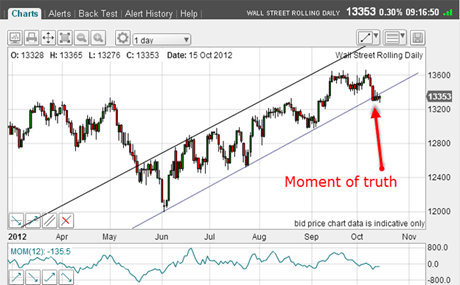
And finally, let's take a peek at the long-term tramlines I have been working with:
(Click on the chart for a larger version)
The market is playing with the lower tramline and may well hang around it a while longer. This is the moment of truth for the bulls.
A sharp break down here would be very bearish and indicate my 13,000 major target is within reach.
If you're a new reader, or need a reminder about some of the methods I refer to in my trades, then do have a look at my introductory videos:
The essentials of tramline trading
An introduction to Elliott wave theory
Advanced trading with Elliott waves
Don't miss my next trading insight. To receive all my spread betting blog posts by email, as soon as I've written them, just sign up here . If you have any queries regarding MoneyWeek Trader, please contact us here.
Get the latest financial news, insights and expert analysis from our award-winning MoneyWeek team, to help you understand what really matters when it comes to your finances.
John is is a British-born lapsed PhD physicist, who previously worked for Nasa on the Mars exploration team. He is a former commodity trading advisor with the US Commodities Futures Trading Commission, and worked in a boutique futures house in California in the 1980s.
He was a partner in one of the first futures newsletter advisory services, based in Washington DC, specialising in pork bellies and currencies. John is primarily a chart-reading trader, having cut his trading teeth in the days before PCs.
As well as his work in the financial world, he has launched, run and sold several 'real' businesses producing 'real' products.
-
 Average UK house price reaches £300,000 for first time, Halifax says
While the average house price has topped £300k, regional disparities still remain, Halifax finds.
-
 Barings Emerging Europe trust bounces back from Russia woes
Barings Emerging Europe trust has added the Middle East and Africa to its mandate, delivering a strong recovery, says Max King