What this latest chart pattern means for the Dow
The Dow Jones is entering a very exciting phase, says John C Burford. Here, he looks at how to play it.
Get the latest financial news, insights and expert analysis from our award-winning MoneyWeek team, to help you understand what really matters when it comes to your finances.
You are now subscribed
Your newsletter sign-up was successful
Want to add more newsletters?

Twice daily
MoneyWeek
Get the latest financial news, insights and expert analysis from our award-winning MoneyWeek team, to help you understand what really matters when it comes to your finances.

Four times a week
Look After My Bills
Sign up to our free money-saving newsletter, filled with the latest news and expert advice to help you find the best tips and deals for managing your bills. Start saving today!
Today, we should look again at the Dow. I believe it's entering a very exciting phase. I've got my strategy in place, as you'll see below.
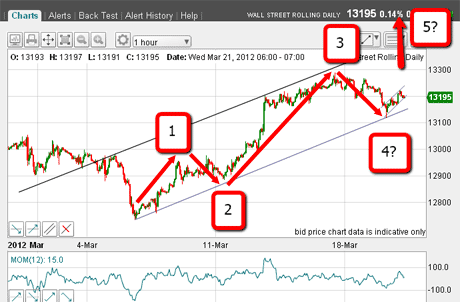
Last Wednesday, we saw how the market had been climbing along my very pretty tramline pair.
At that stage, the Dow had put in a potential four waves of a possible five-wave Elliott wave pattern. The fifth wave would lie above my third wave high at the 13,300 level my original target for the top.
MoneyWeek
Subscribe to MoneyWeek today and get your first six magazine issues absolutely FREE

Sign up to Money Morning
Don't miss the latest investment and personal finances news, market analysis, plus money-saving tips with our free twice-daily newsletter
Don't miss the latest investment and personal finances news, market analysis, plus money-saving tips with our free twice-daily newsletter
So how is itunfolding?
On Wednesday, the market had made a nice A-B-C rally off wave 4. It had made it to the Fibonacci 62% retrace of the move off the 13,300 high.
The rally was in danger of stalling, since this Fibonacci level is often used by the market to stage a turn-around. Here is the chart from Wednesday again:
(Click on the chart for a larger version)
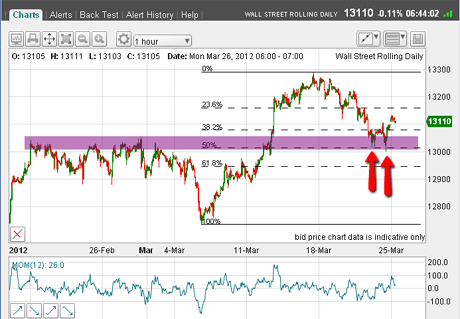
In fact, the market did fall away off this level into Friday, where it made a new low, but found solid support:
(Click on the chart for a larger version)
I have drawn a purple bar to indicate chart support. Note the large consolidation zone in late February/early March. That upper region will act as support on declines, as it has here.
The Dow is rallying for now but keep reading
Also, note the two failed attempts to break down through this support (red arrows) together with the positive momentum divergence (the green arrows on the next chart).
Another vital clue to forecasting a rally up ahead is the decline into the precise Fibonacci 50% retrace of the rally off the 6 March low.
So the odds favoured a rally off this level. Short-term traders were taking profits from their short trades around here.
OK, so we have a rally this morning. Will the market go on to make my possible wave 5 above 13,300?
Or will it respect that 13,300 high as my ending fifth wave up ie of the rally in my large wave C up from the November low?
That's what I'm waiting to find out!
Let's have a look now at the form of the decline:
(Click on the chart for a larger version)
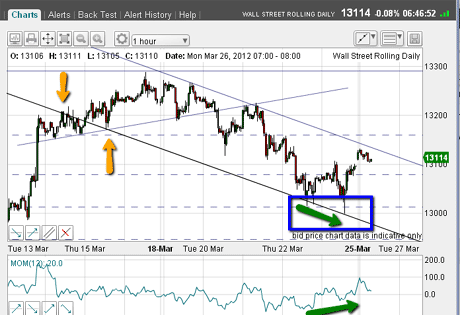
I can now draw in a tentative tramline pair. The lower one has the benefit of lovely touch-points marked by yellow arrows and it touches Friday's lows beautifully.
My upper line takes in the two highs. The market is currently approaching this line.
This is a very solid tramline pair. I expect the lines to continue to repel advances and support declines.
The area marked by my blue box contains the two bounces off the Fibonacci 50% level, and the positive momentum divergence I mentioned earlier (green arrows).
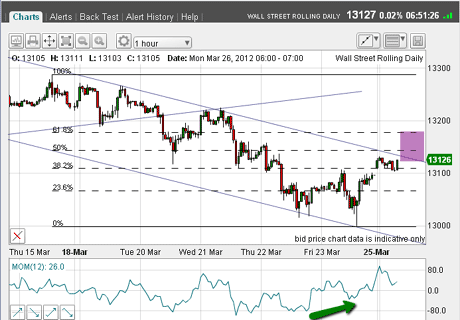
So now I have Friday's low as a pivot point, I can draw in another set of Fibonacci retrace lines this time, using the 13,300 high as my upper pivot point.
(Click on the chart for a larger version)
Overnight, the market has overcome the 38% level and is approaching the 50% level as I write.
There could be a big decline coming on the Dow
As you know, I love to see A-B-C formations in counter-trend moves and I'm hoping to see one here. That would help confirm we are in a new bear market phase.
I have marked in purple my ideal zone for the rally to reverse. It may or may not make it. My new down-sloping tramline should act as strong resistance.
Also note the form of the decline I mentioned above. I can see several candidates for five-wave patterns. If I'm correct, that also firms up my forecast that the 13,300 level was the top. If so, there will not be a fifth wave up above 13,300.
As I write, the odds favour limited upside progress from here. And a break of Friday's lows will really cement my forecast for a vigorous decline to the 12,900 area.
I've shown that with a blue box here at the crossing of my lower tramline and the Fibonacci 62% retrace:
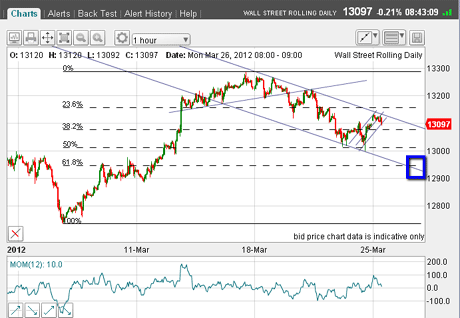
(Click on the chart for a larger version)
So for now, my strategy will continue to be to probe the downside by shorting rallies.
If you're a new reader, or need a reminder about some of the methods I refer to in my trades, then do have a look at my introductory videos:
The essentials of tramline trading
An introduction to Elliott wave theory
Advanced trading with Elliott waves
Don't miss my next trading insight. To receive all my spread betting blog posts by email, as soon as I've written them, just sign up here .
Get the latest financial news, insights and expert analysis from our award-winning MoneyWeek team, to help you understand what really matters when it comes to your finances.
John is is a British-born lapsed PhD physicist, who previously worked for Nasa on the Mars exploration team. He is a former commodity trading advisor with the US Commodities Futures Trading Commission, and worked in a boutique futures house in California in the 1980s.
He was a partner in one of the first futures newsletter advisory services, based in Washington DC, specialising in pork bellies and currencies. John is primarily a chart-reading trader, having cut his trading teeth in the days before PCs.
As well as his work in the financial world, he has launched, run and sold several 'real' businesses producing 'real' products.
-
 MoneyWeek Talks: The funds to choose in 2026
Podcast Fidelity's Tom Stevenson reveals his top three funds for 2026 for your ISA or self-invested personal pension
-
 Three companies with deep economic moats to buy now
Opinion An economic moat can underpin a company's future returns. Here, Imran Sattar, portfolio manager at Edinburgh Investment Trust, selects three stocks to buy now