The moment of truth for the Dow
The Dow has reached a critical juncture - but where will the market go from here? John C Burford uses his tried and tested trading methods to find out.
Get the latest financial news, insights and expert analysis from our award-winning MoneyWeek team, to help you understand what really matters when it comes to your finances.
You are now subscribed
Your newsletter sign-up was successful
Want to add more newsletters?

Twice daily
MoneyWeek
Get the latest financial news, insights and expert analysis from our award-winning MoneyWeek team, to help you understand what really matters when it comes to your finances.

Four times a week
Look After My Bills
Sign up to our free money-saving newsletter, filled with the latest news and expert advice to help you find the best tips and deals for managing your bills. Start saving today!
It's time to look at the Dow again.
As you'll know if you've been reading MoneyWeek Trader for a while, I've been looking for a top in stocks to complete the massive bear market rally off the October low. But it hasn't happened yet.
The better economic data out of the US has gone hand-in-hand with this rally. Both have been the result of a pick-up in positive public mood from the depths of despair last October.
MoneyWeek
Subscribe to MoneyWeek today and get your first six magazine issues absolutely FREE

Sign up to Money Morning
Don't miss the latest investment and personal finances news, market analysis, plus money-saving tips with our free twice-daily newsletter
Don't miss the latest investment and personal finances news, market analysis, plus money-saving tips with our free twice-daily newsletter
Mapping the mood of the market with Elliott waves
Positive mood means the public want to own stocks. Negative mood creates the desire to sell them. It is the great sweeps in mood that drive markets and these sweeps, as I am keen to show you in these emails, are reflected in Elliott waves.
Isn't it curious that when in a bull market, bad' news is often considered good' for the market?! It appears perverse, but can be entirely consistent with the technical picture and that is what counts.
The signals I am watching are my tried and true tramlines, Fibonacci and Elliott waves. I also like to look at extremes in trader/investor/advisor sentiment.
As you also know, I rarely mention the fundamentals'. That's because I have found that getting trade-timing signals off them can be a fool's errand.
But I found this recent item, which should be something for the bulls to chew over: "New data from the US Commerce Department show employee pay is down to the smallest share of the economy since the government began collecting wage and salary data in 1929. Meanwhile, corporate profits now constitute the largest share of the economy since 1929."
With real wages still trending down, can the US economy grow, since 70% of US GDP depends on personal consumption, and consumers still have huge debt levels?
And can corporate profits which are supporting share prices continue to grow as they have in the past three years, companies having squeezed costs to the bone since the credit crunch?
Is mention of 1929 and we know the aftermath an omen?
As I said something for the bulls to ponder!
But back to the charts! That's why you're here and there are some interesting signs in the charts of the Dow just lately.
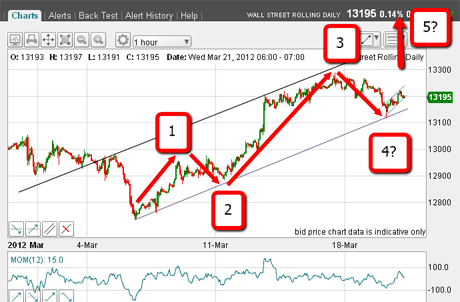
Last time, I analysed the recent rally phase. I was able to label a 5-wave Elliott pattern off the December lows.
Then, in the fifth wave of this pattern, I could count waves 1, 2 and a potential third wave. The implication was that there should be a new high above wave 3 in a final fifth wave.
My upper wedge line passed through the 13,300 area and was my initial target for the top (see previous posts).
This is how it developed:
(Click on the chart for a larger version)
The market rallied very close to 13,300 to a high of 13,288 in fact and then consolidated. This is about as close to perfect as is possible when setting targets days and weeks in advance.
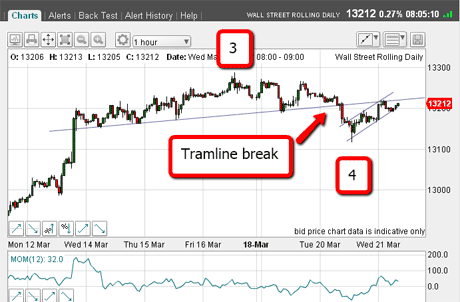
So, how are my Elliott wave counts working out? On my next chart, I have drawn a pair of pretty good tramlines, where my waves 2 and 4 lie on the lower line this is good. Wave 4 was put in yesterday, following a good break of this tramline:
(Click on the chart for a larger version)
That tramline had been supporting the market for a few days. A break was likely to be significant, as there were masses of sell-stops underneath placed there by longs nervous of the potential for a top.
Of course, if my labels are correct, we should see a new high above the wave 3 high at 13,300.
Which way next for the Dow?
But note the tramline break to the wave 4 and the rebound back to the underside. This is the moment of truth the market can either turn around here, or push on upwards towards my possible wave 5.
So how do I play it?
I could enter short-selling orders here and place a close stop somewhat above the tramline. That would be a low-risk trade.
Or, I could wait for more confirmation that the market had turned.
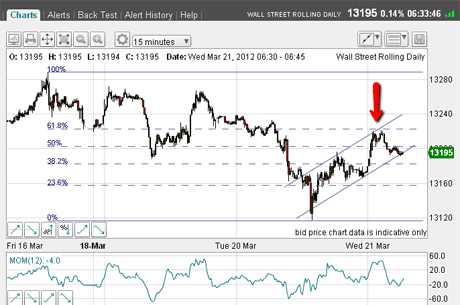
The rally off the wave 4 low appears to have an A-B-C form (so far):
(Click on the chart for a larger version)
I can also draw a nice tramline pair. The market has made it to the crossing of the upper tramline and the Fibonacci 62% retrace (red arrow). It has fallen back down to the lower tramline as I write.
Trading with the trend that's a signal for me to go long.
This is what trading is about dealing with mixed signals
As it stands I am getting mixed signals a likely rally short-term and a possible decline longer term. In fact, a typical set-up for a trader!
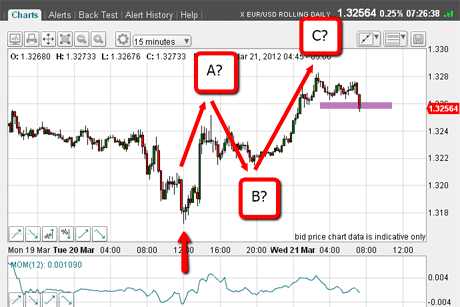
Recall that recently, I have noted that the EUR/USD and the Dow were deviating from their normal in-synch behaviour. But look at the recent euro chart:
(Click on the chart for a larger version)
Both markets made their lows at the same time (red arrow), and are both rallying in three waves (so far). They are now back in synch.
That means I can now rely on each market to give me a heads-up of what to expect in the other. Sometimes, checking a related market can give valuable information.
If my A-B-C labels are correct, I can test this by shorting the euro (and hence the Dow) around the level of my purple bar and setting a close stop just above my wave C. This would be a low-risk trade.
If I was feeling more conservative, I might look to short on a break of the B wave.
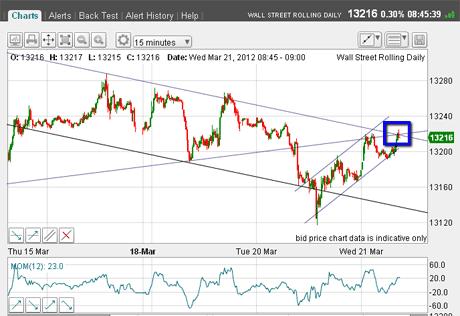
OK, back to the Dow. If the market continues up from here, where could it turn? Here is the latest chart:
(Click on the chart for a larger version)
The market has this morning pushed up off the lower tramline. Now I can draw in a tentative down-sloping tramline pair. The market is now at the crossing of the new upper tramline and the old' up-sloping one (blue box).
That could be the top (for now), but a punch up through the blue box would strengthen considerably my case for a new high above 13,300.
I shall be watching this rally very carefully. This is what trading is all about. Watching, waiting, seeing what the charts are telling me. I'll get a clearer picture soon and the chance to make some good profits!
If you're a new reader, or need a reminder about some of the methods I refer to in my trades, then do have a look at my introductory videos:
The essentials of tramline trading
An introduction to Elliott wave theory
Advanced trading with Elliott waves
Don't miss my next trading insight. To receive all my spread betting blog posts by email, as soon as I've written them, just sign up here .
Get the latest financial news, insights and expert analysis from our award-winning MoneyWeek team, to help you understand what really matters when it comes to your finances.
John is is a British-born lapsed PhD physicist, who previously worked for Nasa on the Mars exploration team. He is a former commodity trading advisor with the US Commodities Futures Trading Commission, and worked in a boutique futures house in California in the 1980s.
He was a partner in one of the first futures newsletter advisory services, based in Washington DC, specialising in pork bellies and currencies. John is primarily a chart-reading trader, having cut his trading teeth in the days before PCs.
As well as his work in the financial world, he has launched, run and sold several 'real' businesses producing 'real' products.
-
 MoneyWeek Talks: The funds to choose in 2026
Podcast Fidelity's Tom Stevenson reveals his top three funds for 2026 for your ISA or self-invested personal pension
-
 Three companies with deep economic moats to buy now
Opinion An economic moat can underpin a company's future returns. Here, Imran Sattar, portfolio manager at Edinburgh Investment Trust, selects three stocks to buy now