This chart pattern is warning of a Dow reversal
The Dow may have soared to new highs in recent days. But John C Burford explains the alarm bell in the charts that's calling time on the market's rise.
Get the latest financial news, insights and expert analysis from our award-winning MoneyWeek team, to help you understand what really matters when it comes to your finances.
You are now subscribed
Your newsletter sign-up was successful
Want to add more newsletters?

Twice daily
MoneyWeek
Get the latest financial news, insights and expert analysis from our award-winning MoneyWeek team, to help you understand what really matters when it comes to your finances.

Four times a week
Look After My Bills
Sign up to our free money-saving newsletter, filled with the latest news and expert advice to help you find the best tips and deals for managing your bills. Start saving today!
As regular readers will know, I don't think this Dow rally has long to live. In Monday'spost, I made a strong case for a top at the 13,050 level.
But yesterday, the Dow overcame all resistance there and shot up to the 13,200 level!
Although the odds did favour at least a significant decline this week, the market had other ideas! And that is why I use my 3% rule to protect against a major loss.
MoneyWeek
Subscribe to MoneyWeek today and get your first six magazine issues absolutely FREE

Sign up to Money Morning
Don't miss the latest investment and personal finances news, market analysis, plus money-saving tips with our free twice-daily newsletter
Don't miss the latest investment and personal finances news, market analysis, plus money-saving tips with our free twice-daily newsletter
What do I think of this latest action? Have I changed my outlook? Not yet.
Yes, I was wrong in guessing the immediate market direction. But this morning I am much more excited about what the charts are telling me than I was on Monday!
I'll tell you why in just a moment
But being wrong on a trade is no sin, so long as the usual rules and guidelines and money-management stop strategies are followed.
Trader tip: There is no system on earth that can guarantee success in every trade, mine included. Professional traders trade the percentages (the odds) and take their fair share of losses, which they consider in the same way as a business owner looks at their necessary expenses to run the business. It's vital to think of trading that way, in my view.
OK, why am I more excited this morning?
Why this fifth wave points to a likely reversal soon
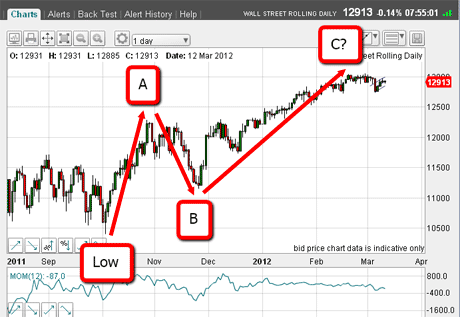
Take a look again at this chart from Monday's issue:

(Click on the chart for a larger version)
On Monday, I labeled the 27 October high as wave A, the 25 November low as wave B and we are currently in wave C, which has now extended to a new high.
The C wave is a third wave according to Elliott wave theory, and so should possess many of the characteristics of third waves, such as being long and strong'.
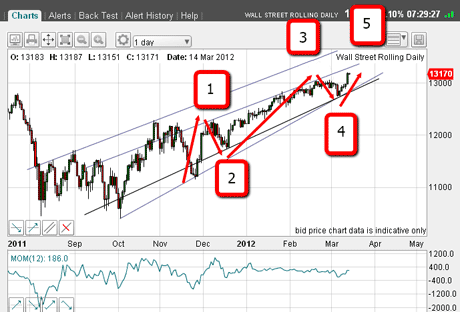
Yesterday's push up helped confirm this aspect but look at the structure of my C wave in this updated chart, now there is a new high for the move. I can now count a very clear and well proportioned five waves.

(Click on the chart for a larger version)
The third wave is certainly long and strong, and waves 2 and 4 are in nice proportion.
This is what is making me excited! With the market currently in a fifth wave, I'm confident the market is near a reversal, since fifth waves are ending waves.
Before I move to a closer chart, with last Tuesday's low in place, I can now draw a very nice tramline connecting the major lows of October and November. It passes nicely through Tuesday's low. This line should be significant later this year.
The upper line connects the major highs of August and October and interestingly, lies parallel to my central line, which is my upper wedge line. This line may come into play later.
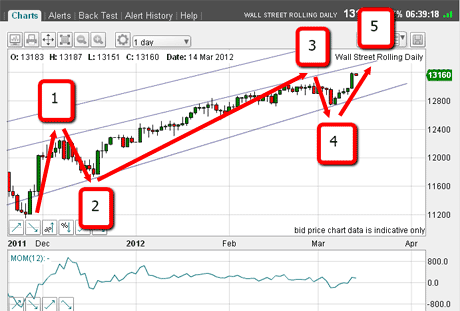
You can see my five-wave formation more clearly on this chart:

(Click on the chart for a larger version)
What I see is that the market is now in a fifth wave and in new high ground well above the wave 3 high at 13,050.
The crucial thing for me to note is that it could turn at any time and still satisfy the Elliott wave rules.
But it's also important to know that fifth waves can extend for some time even to a distance beyond the length of the third wave. And in these extended fifth waves, they themselves can be patterned in five smaller waves!
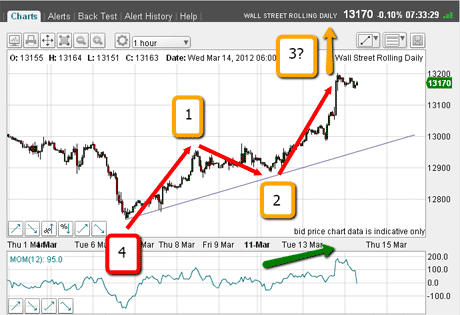
Let us see how the current wave shapes up:

(Click on the chart for a larger version)
From the red wave 4 low of last week I can count waves 1 and 2 (yellow). With yesterday's strong push, that qualifies as being in a potential third wave.
The green arrow shows how momentum has zoomed up giving the strong' element to this wave. So far, so good. This third wave could carry higher from here, of course.
Obviously, a possible upside target is my upper wedge line shown on the first chart, currently passing through the 13,300 area 100 pips away or so.
And if the market becomes really excited, my upper tramline at the 13,600 area is a possible target, but I put this as a low probability. Why?
Either the Dow or gold is due a major adjustment
Although the stock bulls were totally in charge yesterday, in the linked markets of gold and the EUR/USD, the bears were in complete control. Gold fell $50 at one point, while the Dow rallied over 200 pips.
Also, gold is off $120 from its recent high, while the Dow is making new highs.
Something is very amiss, as asset markets have been more-or-less acting in synch due to the waves of liquidity (mainly bank and hedge fund credit) driving all markets.
My conclusion: One market is lying! Is it the Dow, or is it gold? When the culprit is unmasked, there will be a major adjustment.
I hope to cover gold on Friday, as it is offering up some valuable trading lessons.
If you're a new reader, or need a reminder about some of the methods I refer to in my trades, then do have a look at my introductory videos:
The essentials of tramline trading
An introduction to Elliott wave theory
Advanced trading with Elliott waves
Don't miss my next trading insight. To receive all my spread betting blog posts by email, as soon as I've written them, just sign up here .
Get the latest financial news, insights and expert analysis from our award-winning MoneyWeek team, to help you understand what really matters when it comes to your finances.
John is is a British-born lapsed PhD physicist, who previously worked for Nasa on the Mars exploration team. He is a former commodity trading advisor with the US Commodities Futures Trading Commission, and worked in a boutique futures house in California in the 1980s.
He was a partner in one of the first futures newsletter advisory services, based in Washington DC, specialising in pork bellies and currencies. John is primarily a chart-reading trader, having cut his trading teeth in the days before PCs.
As well as his work in the financial world, he has launched, run and sold several 'real' businesses producing 'real' products.
-
 Average UK house price reaches £300,000 for first time, Halifax says
While the average house price has topped £300k, regional disparities still remain, Halifax finds.
-
 Barings Emerging Europe trust bounces back from Russia woes
Barings Emerging Europe trust has added the Middle East and Africa to its mandate, delivering a strong recovery, says Max King