The key level to watch on the Dow
Extreme bullishness pervades the Dow - and that spells trouble, says John C Burford. Here, he turns to the charts in search of the market top.
Get the latest financial news, insights and expert analysis from our award-winning MoneyWeek team, to help you understand what really matters when it comes to your finances.
You are now subscribed
Your newsletter sign-up was successful
Want to add more newsletters?

Twice daily
MoneyWeek
Get the latest financial news, insights and expert analysis from our award-winning MoneyWeek team, to help you understand what really matters when it comes to your finances.

Four times a week
Look After My Bills
Sign up to our free money-saving newsletter, filled with the latest news and expert advice to help you find the best tips and deals for managing your bills. Start saving today!
In my lastpost on the Dow on 7 March, I noted that the dramatic 200-point decline off the 13,050 high last Tuesday may well be the prelude to further falls.
I also noted that the 13,050 high could be the top to the bear market rally off the October lows.
What I did not note then was how important the 13,050 level really is.
MoneyWeek
Subscribe to MoneyWeek today and get your first six magazine issues absolutely FREE

Sign up to Money Morning
Don't miss the latest investment and personal finances news, market analysis, plus money-saving tips with our free twice-daily newsletter
Don't miss the latest investment and personal finances news, market analysis, plus money-saving tips with our free twice-daily newsletter
Here is why.
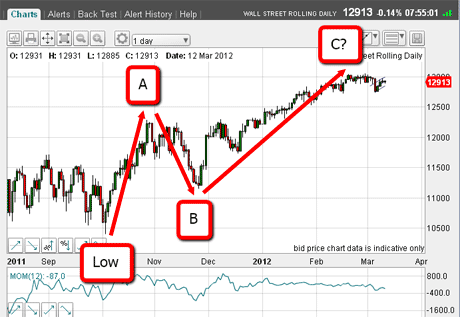
In A-B-C corrections, a very common relationship in Elliott wave theory is for equality of the A and C waves. This applies in both bull and bear markets.
So let us see what that implies for the current C wave.

(Click on the chart for a larger version)
The October 10,402 level is the low. From there, the A wave took the market to a high of 12,286, a distance of 1,884 pips.
From there, the market fell to the B wave low at 11,150.
How this Elliott wave rule can help me work out target levels
Now if I measure 1,884 pips up from the wave B low, I get a target for the C wave of 13,034.
So far, the high has been 13,054 made on 29 February only 20 pips off.
Isn't that remarkable?
Just consider what I have done. From the wave B low made in November, I have used a simple Elliott wave rule to estimate an upper target for the ending of the rally! This target has been in place for a few months.
Also, if the 13,050 level holds, that would solidly confirm my A-B-C labels are correct and that the bear market is intact.
This is crucial information.
Trader tip: Before we all go out and use this rule on every A-B-C pattern, I must tell you that there are other A and C wave relationships that occur! But the equality rule is very common and along with other evidence, it can be used to set pretty accurate targets for reversals.
But now, I want to get back to basics and remind myself of the big picture.
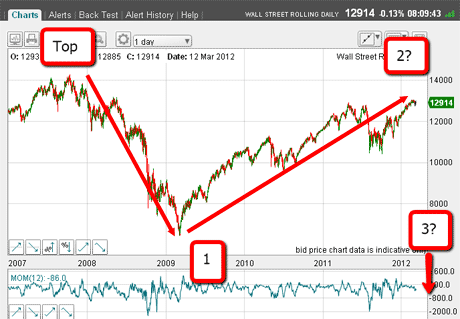
Here is the daily chart going back to the all-time 14,400 high made in 2007:

(Click on the chart for a larger version)
From the top, the big plunge to the 6,400 area, I have labelled wave 1 down. I am assuming that we are at the start of a massive multi-year five-wave pattern down off the 14,400 top.
Recall that at this low, sentiment was extremely bearish and the market was rife with end-of-the-world predictions following the banking crisis. It was clear that the herd was heading for the cliffs!
But we know that major lows are almost always put in when sentiment reaches off-the-scale bearishness.
That panic selling provided the opportunity for smart traders/investors to put into practice what most know they should do, but fail to do, as their emotions over-rule their better judgment they should buy low and sell high.
This is the most basic of investing rules that is flouted by most. Investors sold low.
The other side of that coin is to sell high'. That brings us to today.
My indicators now point to extreme bullishness
With the market doubling in four years, the market has reached the opposite extreme one of off-the-scale bullishness. Most of the indicators I follow have reached extreme levels of bullishness.
This has followed several months of better economic data points from the USA, and has encouraged the majority to believe the American economy has "turned the corner".
Remember, I need an extreme in bullishness to be confident the wave 2 top is imminent.
So, is this the time when smart investors should sell high? Are we close to a top in a wave 2, prior to a massive decline in a huge wave 3?
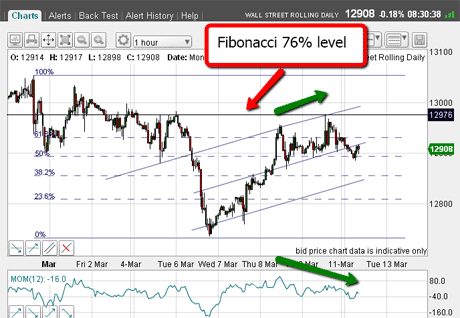
On 7 March, I noted the rally off last Tuesday's low to have reached a 23% Fibonacci retrace.
Since then, the market extended the rally to reach a higher, but very significant Fibonacci level. You can see that here:

(Click on the chart for a larger version)
To illustrate that stock market tops are usually very drawn-out affairs, the market rallied beyond my suggested 38% retrace and carried right on up to just above the 62% level.
It then fell back, before making it to the precise 76% level on Friday and on a potential negative momentum divergence on the hourly chart (marked by green arrows). This is often a prelude to a reversal.
I have also put in my tentative tramlines to this rally. I like them, especially because the upper one has that superb anchor-point at last Monday's low.
If you have not seen my video tutorial on my tramline trading methods, you can see them here.
As I write this morning, the market overnight has dropped below the centre tramline and is rebounding in a kiss'.
Summing up, as I see it this morning, the odds favour the 13,050 high as being the top of my wave 2 this is the level I'm watching.
Confirmation would come if the market can stage declines at least as big as the 200-point decline of 29 February.
In the meantime, the Dow could consolidate around current levels for a while longer. I'll be studying it carefully and I'll let you know what I see.
If you're a new reader, or need a reminder about some of the methods I refer to in my trades, then do have a look at my introductory videos:
The essentials of tramline trading
An introduction to Elliott wave theory
Advanced trading with Elliott waves
Don't miss my next trading insight. To receive all my spread betting blog posts by email, as soon as I've written them, just sign up here .
Get the latest financial news, insights and expert analysis from our award-winning MoneyWeek team, to help you understand what really matters when it comes to your finances.
John is is a British-born lapsed PhD physicist, who previously worked for Nasa on the Mars exploration team. He is a former commodity trading advisor with the US Commodities Futures Trading Commission, and worked in a boutique futures house in California in the 1980s.
He was a partner in one of the first futures newsletter advisory services, based in Washington DC, specialising in pork bellies and currencies. John is primarily a chart-reading trader, having cut his trading teeth in the days before PCs.
As well as his work in the financial world, he has launched, run and sold several 'real' businesses producing 'real' products.
-
 Average UK house price reaches £300,000 for first time, Halifax says
While the average house price has topped £300k, regional disparities still remain, Halifax finds.
-
 Barings Emerging Europe trust bounces back from Russia woes
Barings Emerging Europe trust has added the Middle East and Africa to its mandate, delivering a strong recovery, says Max King