The Dow breaks down – has it finally topped?
The Dow's recent plunge has exhibited many of John C Burford's spread betting theories in action. So, where to next for the Dow?
Get the latest financial news, insights and expert analysis from our award-winning MoneyWeek team, to help you understand what really matters when it comes to your finances.
You are now subscribed
Your newsletter sign-up was successful
Want to add more newsletters?

Twice daily
MoneyWeek
Get the latest financial news, insights and expert analysis from our award-winning MoneyWeek team, to help you understand what really matters when it comes to your finances.

Four times a week
Look After My Bills
Sign up to our free money-saving newsletter, filled with the latest news and expert advice to help you find the best tips and deals for managing your bills. Start saving today!
Gold will have to wait.
The action in the Dow is far more exciting and is illustrating in real time many of the trading principles that I use. These are great insights for you from an important development in the market.
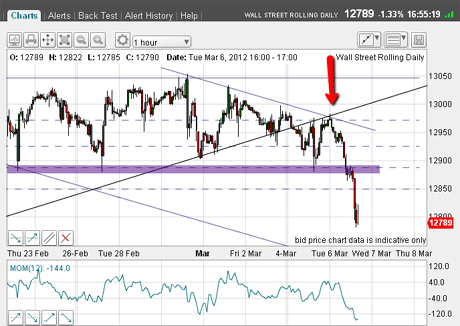
On 2 March, I gave you powerful evidence that the impressive bear market rally of the past several months was likely ending at the 13,000 area.
MoneyWeek
Subscribe to MoneyWeek today and get your first six magazine issues absolutely FREE

Sign up to Money Morning
Don't miss the latest investment and personal finances news, market analysis, plus money-saving tips with our free twice-daily newsletter
Don't miss the latest investment and personal finances news, market analysis, plus money-saving tips with our free twice-daily newsletter
I also said that if the lower trendline of the rising wedge were to be broken, that would give me the signal to short the market.
Dow falls through support on heavy selling
Here is a chart taken yesterday just after the big break. You can see how on Monday, the market declined to chart support (indicated by the purple bar). But after that, it rallied again late on Monday to close just slightly down on the day.

(Clickon the chart for a larger version)
Yesterday, though, the selling really kicked in, with the Dow falling heavily all day, taking it clean through that purple line of support.
Note that the late Monday rally carried right to the underside of the up-sloping wedge trendline. But the market then suffered a'scalded cat bounce' down.
Trader Tip: I often see this behaviour where a tramline is broken, then a pull-back to the line, and then a rapid move away (I call this the 'scalded cat bounce' in honour of the well-known 'dead cat bounce effect'). These pull-backs allow for a late entry in case you missed an earlier one.
Using Elliott waves to work out my roadmap'
Also note the down-sloping tramline I have drawn over the minor highs of Wednesdayto Friday. That was an additional point of resistance for the Dow.
What I can see here is a double dose of selling resistance at the red arrow level.
And it was that reversal right there that kicked off the strong 200 plus-pip drop yesterday.
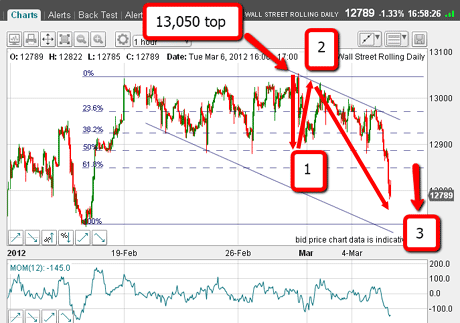
So, with the strong move down through support levels yesterday, I could now draw in some tentative Elliott wave labels:

(Clickon the chart for a larger version)
I also took this chart yesterday right after the break down. If my top is at 13,050, I can count waves 1 down from that top and 2 up.
With the move below wave 1, I can say we are in the third wave. Remember, these third waves are usually long and strong'.
What I need to see if we are currently in a third wave is a continuing rapid move down with no major rallies. Minor rallies can be used to enter short positions.
On the chart above, I also drew a tentative lower tramline. That could be a major target area for me perhaps where wave 3 ends, prior to a rally in wave 4.
So right away, I have a possible road map for where the market is likely to traverse over the next few hours or days.
This is powerful information, since any major deviation from it over the next few hours would cancel out this Elliott wave analysis. I would then need to make changes to my trading stance.
Trading Tip: Compare this situation with a trader who does not have any road map at all just hopes and prays their position will work out. Although of course it is not fail-safe, Elliott wave theory is the only method I know that can offer such a scientific forecasting tool. This is what I am keen to show you in these MoneyWeek Trader posts. (For more on Elliott wave, see my short tutorial video: Advanced trading with Elliott waves.)
Another sign that the Dow could see a major fall
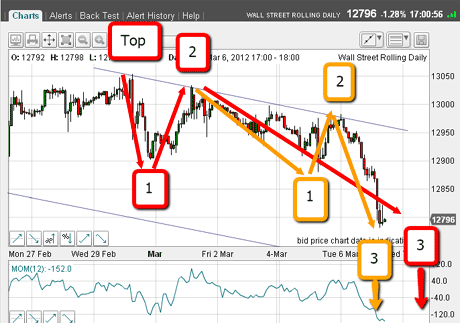
OK, that is not all! Because Elliott waves are fractals (they take the same form in any time frame), I can spot another set of them. Take a look at the next chart:

(Clickon the chart for a larger version)
Wave 2 (red) is the top of my new count (on a shorter time frame), and Monday's low is my new Wave 1 (yellow). Late Monday's rally high is my new Wave 2 (yellow), and we are currently in Wave 3 (yellow).
That means we are in two third waves down. Potentially, this is a powerful combination and should lead to major losses very quickly.
But of course, if I am correct, it will not be straight down. The markets do not give up their riches that easily!
Many investors will be buying on the dips, since that strategy has worked beautifully since October during the rally. Will it this time? We'll see
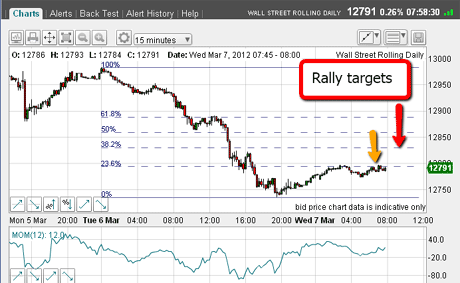
So let's see where we are as I write:

(Clickon the chart for a larger version)
For the benefit of newer traders, remember that the charts I've used in thispost are of the Dow rolling daily contract my spread betting company provides. So although the Dow itself is closed, I can still trade it out of hours'.
As you can see on the above chart, we are in a relief rally this morning. I have drawn in the Fibonacci retrace levels and the market is trading up to the 23% level as I write this.
If the relief rally fails look out below!
If we are in a new bear move, I expect the counter-trend rallies to be three-wave affairs my A-B-C pattern. That is one identifier of the direction of the main trend and helps confirm the bear market.
As I write, I can see the market is on its second attempt of the 23% level. But the chart would look better if it made it to the 38% level that way, the A-B-C pattern would be clear. And that could be a great place for me tothink about shorting.
But it may not make it to 38%, since we are in two third waves down. If the down pressure is intense, such a shallow rally would be extremely bearish.
My first target remains at the lower tramline in the 12,650 region.
Meanwhile, I have moved my protective stops to break-even. I have a free ride.
If you're a new reader, or need a reminder about some of the methods I refer to in my trades, then do have a look at my introductory videos:
The essentials of tramline trading
An introduction to Elliott wave theory
Advanced trading with Elliott waves
Don't miss my next trading insight. To receive all my spread betting blog posts by email, as soon as I've written them, just sign up here .
Get the latest financial news, insights and expert analysis from our award-winning MoneyWeek team, to help you understand what really matters when it comes to your finances.
John is is a British-born lapsed PhD physicist, who previously worked for Nasa on the Mars exploration team. He is a former commodity trading advisor with the US Commodities Futures Trading Commission, and worked in a boutique futures house in California in the 1980s.
He was a partner in one of the first futures newsletter advisory services, based in Washington DC, specialising in pork bellies and currencies. John is primarily a chart-reading trader, having cut his trading teeth in the days before PCs.
As well as his work in the financial world, he has launched, run and sold several 'real' businesses producing 'real' products.
-
 Pension Credit: should the mixed-age couples rule be scrapped?
The mixed-age couples rule was introduced in May 2019 to reserve pension credit for older households but a charity warns it is unfair
-
 Average income tax by area: The parts of the UK paying the most tax mapped
The UK’s total income tax bill was £240.7 billion 2022/23, but the tax burden is not spread equally around the country. We look at the towns and boroughs that have the highest average income tax bill.