Forget 13,000 – this is the important level for the Dow
The Dow's recent rally is testament to the power of hope over reality - but can it last? John C Burford turns to the 'fear index' to find out.
Get the latest financial news, insights and expert analysis from our award-winning MoneyWeek team, to help you understand what really matters when it comes to your finances.
You are now subscribed
Your newsletter sign-up was successful
Want to add more newsletters?

Twice daily
MoneyWeek
Get the latest financial news, insights and expert analysis from our award-winning MoneyWeek team, to help you understand what really matters when it comes to your finances.

Four times a week
Look After My Bills
Sign up to our free money-saving newsletter, filled with the latest news and expert advice to help you find the best tips and deals for managing your bills. Start saving today!
There have been some important developments in the EUR/USD, which I last looked at on Wednesday.
I'll bring you right up to date with the euro next week.
I promised you I'd cover the Dow today, though. It's the market everyone's excited about right now as it sits at the 13,000 level.
MoneyWeek
Subscribe to MoneyWeek today and get your first six magazine issues absolutely FREE

Sign up to Money Morning
Don't miss the latest investment and personal finances news, market analysis, plus money-saving tips with our free twice-daily newsletter
Don't miss the latest investment and personal finances news, market analysis, plus money-saving tips with our free twice-daily newsletter
But you've probably already read about the bullish case for that big round number in the mainstream press. In today's MoneyWeek Trader I want to give you some real perspective on where the Dow could be heading.
And of course, I've not forgotten gold. How could I after the $100 plunge on Wednesday? I'll have no shortage of material to cover next week!
But for now let's concentrate on stocks. I have a feeling volatility in stock markets is set to ratchet up more on that later.
Let's get to the charts
The Dow climbs a Wall of Worry
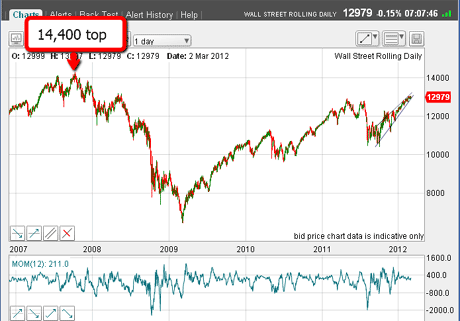
OK, at regular intervals I like to scan the very long-term charts for perspective. Here is the Dow going back several years:

(Click on the chart for a larger version)
From 2003 there was a historic credit-induced bubble in stock prices. That popped at the Dow all-time high of 14,400 in 2007. After that, the market collapsed to the low in March 2009.
Since then, the central banks have been panicked into implementing their "money printing" operations. This has helped markets recover and today at around 13,000, the Dow is within 1,400 pips of the 2007 high.
That is quite a feat, considering the very weak US economic recovery. And it's a testament to the power of hope over reality. The market can be considered as climbing the famous Wall of Worry.
But I believe in working with data rather than raw opinion. So let's get to some of that data.
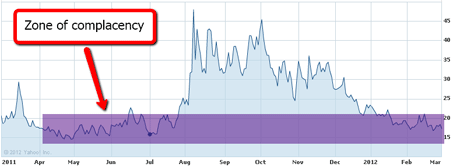
Here is a chart of the VIX going back over a year:

(Click on the chart for a larger version)
You've probably heard talk of the VIX. It's a measure of the volatility of shares and it's often referred to as the "fear" index. (To learn more about it, read What to do as the fear gauge turns red.)
Basically, a high reading means fear stalks the markets, while a low reading means complacency rules.
Why I believe this rally cannot last
It's clear that on the last rally leg especially since November the Dow has been grinding higher with little opposition from any bears out there!
The small dips have been bought as usual. But this comatose state cannot last! And since investor/advisor/money manager sentiment readings have been pushing up to historic highs on this rally leg, the scene is set for a massive wake-up call. It will not take much to upset the cart!
Ominously, trading volumes in US shares has been historically weak for many months, and the rally is being lead by fewer and fewer leaders.
The picture I am seeing is one of declining confidence in the rally. We also have a potential classic Dow theory non-confirmation with the Dow Transports badly lagging the Industrials.
To me, stock markets seem to be running on fumes.
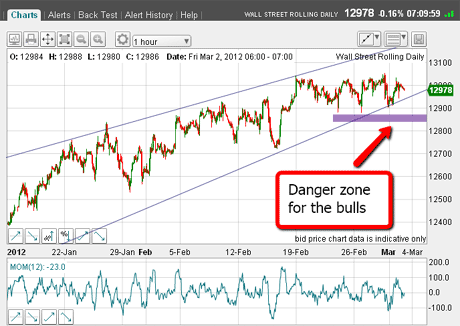
So how does the market look this morning on the hourly chart?

(Click on the chart for a larger version)
The trendlines are my rising wedge boundaries that I have been using in previous posts.
Trader Tip: Trendlines, tramlines, and wedge lines are not placed in stone! You must allow some leeway in case your first placement is a little off. But the more accurate your line is as it clips the minor highs and lows, the more confidence you can have.
The market, so far, is still trading within the wedge. But if there is a break of the lower line, it would be a good signal the rally has ended.
This area could signal the end of the rally
The purple bar I have added shows an area that would give that signal. It lies below the lower line and below the recent minor lows.
That would be a place I might take profits on longs and/or initiate new short trades.
Notice also that the market has been very choppy in this 13,000 area. That could be a sign that much distribution is taking place, as some of the bulls are taking profits and selling to the latecomers.
At some stage, the market will move out of the wedge. It could be up or down, of course. But the data is telling me it is much more likely to be down than up.
One possible scenario is that the market could make a last gasp push up in a spike above the 13,050 area following a "bullish" data release, and then fall back just as quickly. If I see that, it would strengthen my bearish stance.
Interesting times lie ahead and I expect the VIX to show the way. What do you think? If you have any thoughts, leave your comments here.
Look out for MoneyWeek Trader next week. I'll be looking at what's happening with the euro and possibly that big move in gold!
If you're a new reader, or need a reminder about some of the methods I refer to in my trades, then do have a look at my introductory videos:
The essentials of tramline trading
An introduction to Elliott wave theory
Advanced trading with Elliott waves
Don't miss my next trading insight. To receive all my spread betting blog posts by email, as soon as I've written them, just sign up here .
Get the latest financial news, insights and expert analysis from our award-winning MoneyWeek team, to help you understand what really matters when it comes to your finances.
John is is a British-born lapsed PhD physicist, who previously worked for Nasa on the Mars exploration team. He is a former commodity trading advisor with the US Commodities Futures Trading Commission, and worked in a boutique futures house in California in the 1980s.
He was a partner in one of the first futures newsletter advisory services, based in Washington DC, specialising in pork bellies and currencies. John is primarily a chart-reading trader, having cut his trading teeth in the days before PCs.
As well as his work in the financial world, he has launched, run and sold several 'real' businesses producing 'real' products.
-
 MoneyWeek Talks: The funds to choose in 2026
Podcast Fidelity's Tom Stevenson reveals his top three funds for 2026 for your ISA or self-invested personal pension
-
 Three companies with deep economic moats to buy now
Opinion An economic moat can underpin a company's future returns. Here, Imran Sattar, portfolio manager at Edinburgh Investment Trust, selects three stocks to buy now