The Dow hits my 12,500 target
John C Burford rides a classic rally in the Dow Jones, offering fresh lessons in tramline trading as he searches out his next shorting opportunity.
Get the latest financial news, insights and expert analysis from our award-winning MoneyWeek team, to help you understand what really matters when it comes to your finances.
You are now subscribed
Your newsletter sign-up was successful
Want to add more newsletters?

Twice daily
MoneyWeek
Get the latest financial news, insights and expert analysis from our award-winning MoneyWeek team, to help you understand what really matters when it comes to your finances.

Four times a week
Look After My Bills
Sign up to our free money-saving newsletter, filled with the latest news and expert advice to help you find the best tips and deals for managing your bills. Start saving today!
Yesterday, I wrote a bonus' article on the Dow. It was offering such great examples of how I use my methods to forecast and trade, I thought it would be a great help for you.
And this morning, the Dow's offering fresh lessons especially in tramlinetrading.
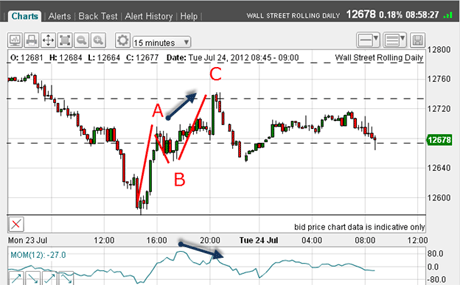
In yesterday's article, I showed the short-term chart of last week's rally:
MoneyWeek
Subscribe to MoneyWeek today and get your first six magazine issues absolutely FREE

Sign up to Money Morning
Don't miss the latest investment and personal finances news, market analysis, plus money-saving tips with our free twice-daily newsletter
Don't miss the latest investment and personal finances news, market analysis, plus money-saving tips with our free twice-daily newsletter

(Click on the chart for a larger version)
The form of the rally is a classic and was suitably tradable. The A-B-Cform, combined with the Fibonacci retrace at the C wave top and the negative momentum divergence made this a terrific entry point for a low-risk trade.
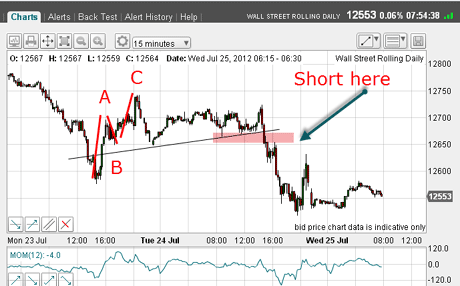
Now, where is the market this morning? Here's the chart:
Dow turns down as it breaks support

(Click on the chart for a larger version)
This is the 15-minute chart, and we can see that the market made a valiant attempt to rally above the C wave high. Remember, I was alert to this possibility yesterday.
But the hopes of the bulls for a big rally on the back of another QE announcement from Bernanke yesterday afternoon were dashed and the market fell back.
It broke the support line shown (upwards sloping black line) and another short entry was indicated at the pink bar.
Market plunges to my 12,500 target
And did you note that the low yesterday was only a few pips from my long-standing target of 12,500? I call that a hit.
But how does all this action fit into the longer-term picture?
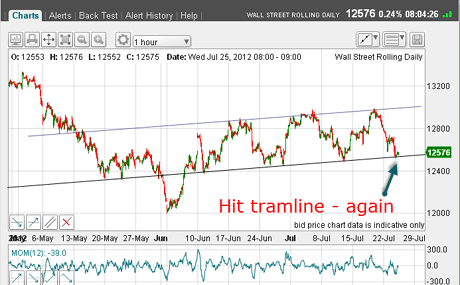
Here is the hourly chart showing my major tramlines:

(Click on the chart for a larger version)
Yes, the drop to 12,500 took the market right to my long-standing lower tramline. That's pretty.
And the tramline did what tramlines do it provided support. So the market bounced late yesterday, and this morning is hovering just above the line.
The big question: will it or won't it?
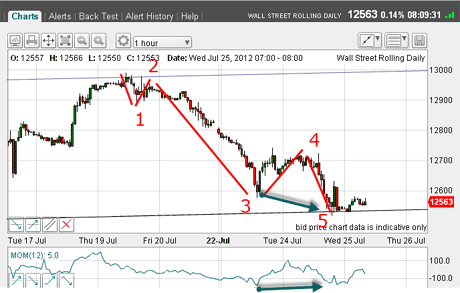
To give me a clue, take a look at the Elliott waves on the big move down from last Thursday's high:

(Click on the chart for a larger version)
I can count a clear five waves with wave 3 long and strong' and a potential positive momentum divergence at wave 5.
And we have the ongoing support from the lower tramline at wave 5.
Putting all this together, I am making a strong case to suggest a rally is on the cards as I write.
That is why short-term traders will be looking to take short-term profits here.
Long-term position traders will be holding they have been short from near the 12,900 area but looking at the wave 4 high as a danger zone! If the market can rally above that (the 12,750 area), the odds would change.
Looking for the next short
But if the market rallies from here in a nice A-B-C with the C wave topping out in the region of wave 4 a normal retracement pattern another shorting opportunity would be presented.
Of course, with the market in a bear trend on the daily chart, I expect a break of the lower tramline at some stage but that will probably be delayed now.
I say that because the sentiment mentioned in yesterday's email is still very negative (see the latest AAII survey results). Perhaps there needs to be another short squeeze as did occur last week.
How's your trading coming along? Let me know below.
If you're a new reader, or need a reminder about some of the methods I refer to in my trades, then do have a look at my introductory videos:
The essentials of tramline trading
An introduction to Elliott wave theory
Advanced trading with Elliott waves
Don't miss my next trading insight. To receive all my spread betting blog posts by email, as soon as I've written them, just sign up here .
Get the latest financial news, insights and expert analysis from our award-winning MoneyWeek team, to help you understand what really matters when it comes to your finances.
John is is a British-born lapsed PhD physicist, who previously worked for Nasa on the Mars exploration team. He is a former commodity trading advisor with the US Commodities Futures Trading Commission, and worked in a boutique futures house in California in the 1980s.
He was a partner in one of the first futures newsletter advisory services, based in Washington DC, specialising in pork bellies and currencies. John is primarily a chart-reading trader, having cut his trading teeth in the days before PCs.
As well as his work in the financial world, he has launched, run and sold several 'real' businesses producing 'real' products.
-
 Average UK house price reaches £300,000 for first time, Halifax says
While the average house price has topped £300k, regional disparities still remain, Halifax finds.
-
 Barings Emerging Europe trust bounces back from Russia woes
Barings Emerging Europe trust has added the Middle East and Africa to its mandate, delivering a strong recovery, says Max King