The Dow is approaching a major tramline
The rally in the Dow has risen to the upper limits of its trading channel. John C Burford examines the charts to see if it is likely to break through.
Get the latest financial news, insights and expert analysis from our award-winning MoneyWeek team, to help you understand what really matters when it comes to your finances.
You are now subscribed
Your newsletter sign-up was successful
Want to add more newsletters?

Twice daily
MoneyWeek
Get the latest financial news, insights and expert analysis from our award-winning MoneyWeek team, to help you understand what really matters when it comes to your finances.

Four times a week
Look After My Bills
Sign up to our free money-saving newsletter, filled with the latest news and expert advice to help you find the best tips and deals for managing your bills. Start saving today!
Today should be eventful. The monthly US Federal Reserve meeting minutes will be released and the market will be reading it very carefully (and nervously).
The reason is very simple the market is fixated on what the Fed does or signals (or does not). The current QE (quantitative easing) programme of buying $85bn worth of bonds per month is under intense scrutiny right now.
The problem is this: the US economy continues to under-perform month after month. It can therefore be argued that the $85bn has been insufficient in terms of producing the level of GDP and jobs growth the Fed is looking for.
MoneyWeek
Subscribe to MoneyWeek today and get your first six magazine issues absolutely FREE

Sign up to Money Morning
Don't miss the latest investment and personal finances news, market analysis, plus money-saving tips with our free twice-daily newsletter
Don't miss the latest investment and personal finances news, market analysis, plus money-saving tips with our free twice-daily newsletter
The Fed isn't the only one with a problem
On the other hand and what economist is short of hands? the massive flow of bank reserve deposits is creating huge asset bubbles' in some markets, particularly the stock markets. The Fed must be eyeing the steep rise in stock markets with alarm.
They have a problem!And so do we, as traders.
Solid resistance at the upper tramline
The S&P consists of 500 companies over a broad range of industries and is considered more risky than the Dow.
Then there is the Nasdaq, which contains many younger and smaller high-tech companies, and is the riskiest of the three.
The S&P and Nasdaq have moved into all-time highs recently, while the Dow has not. There is a clear divergence and that is not a sign of a healthy bull market.
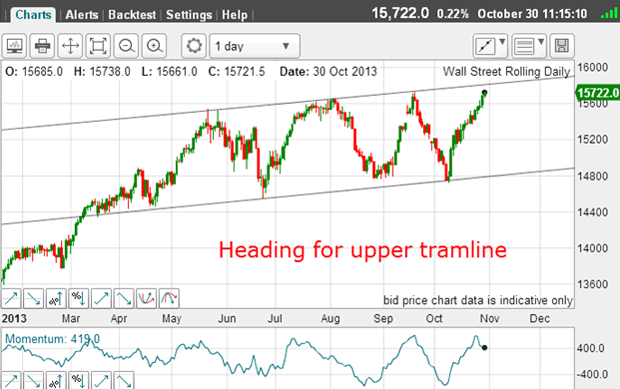
I have kept this chart of the daily Dow for some time:

This is an excellent tramline pair because they both have several good touch points. And today, the market is only around 80 pips off the upper tramline.
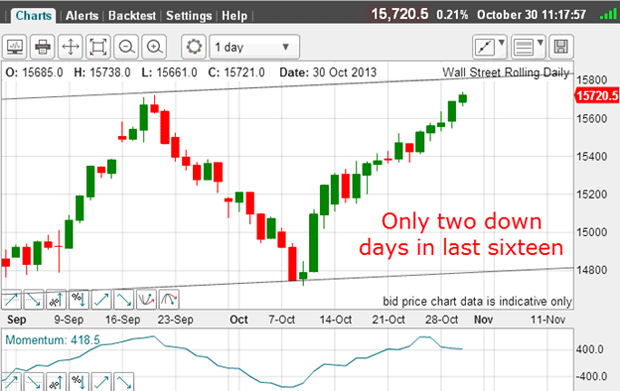
Here is a close-up of the last leg up:

The rally off the early October low has been persistent. It is even more one-sidedly bullish than in the similar period off the 24 June low.
But because my tramlines have contained all trading since March within the trading channel a period of seven months chances are the upper tramline will hold.
Get the latest financial news, insights and expert analysis from our award-winning MoneyWeek team, to help you understand what really matters when it comes to your finances.
John is is a British-born lapsed PhD physicist, who previously worked for Nasa on the Mars exploration team. He is a former commodity trading advisor with the US Commodities Futures Trading Commission, and worked in a boutique futures house in California in the 1980s.
He was a partner in one of the first futures newsletter advisory services, based in Washington DC, specialising in pork bellies and currencies. John is primarily a chart-reading trader, having cut his trading teeth in the days before PCs.
As well as his work in the financial world, he has launched, run and sold several 'real' businesses producing 'real' products.
-
 Average UK house price reaches £300,000 for first time, Halifax says
While the average house price has topped £300k, regional disparities still remain, Halifax finds.
-
 Barings Emerging Europe trust bounces back from Russia woes
Barings Emerging Europe trust has added the Middle East and Africa to its mandate, delivering a strong recovery, says Max King
-
 The challenge with currency hedging
A weaker dollar will make currency hedges more appealing, but volatile rates may complicate the results
-
 It's time to back the yen, says Dominic Frisby
The Japanese yen has been weak for a long time, says Dominic Frisby. That may soon change.
-
 Why a strong dollar hurts – and what you can do about it
Analysis The US dollar is at its strongest level in 20 years. That’s bad news for most investment assets, says John Stepek – here’s why
-
 Could a stronger euro bring relief to global markets?
Analysis The European Central Bank is set to end its negative interest rate policy. That should bring some relief to markets, says John Stepek. Here’s why.
-
 HubSpot: a tech stock set to tumble
Tips US tech stocks have had a fantastic couple of years. But this year is unlikely to be so bullish for high-fliers that can’t turn big profits.
-
 What does the future hold for central bank digital currencies?
Briefings Many of the world's central banks – including the Bank of England – have expressed an interest in creating their own digital currencies. Shivani Khandekar looks at the state of play in central bank digital currencies.
-
 Will the market crash again? Watch the US dollar for clues
Opinion One of the biggest driving factors behind the market’s recent big sell-off was the bounce in the US dollar. John Stepek explains why the price of the dollar matters so much, and why investors should keep a keen eye on it.
-
 The US dollar’s days as the world's most important currency are numbered – it’s official
Features Central bankers reckon the dollar's days as the world’s reserve currency are numbered. But what could replace it? John Stepek takes a look at Bank of England governor Mark Carney's cunning plan.