Could we see a rally in the euro?
With intense interest in the drama unfolding in the eurozone, and market-shaking developments expected over the next few days, most traders are expecting to see the euro tumble. But could they be wrong, and could we see a euro rally? John C Burford investigates.
Get the latest financial news, insights and expert analysis from our award-winning MoneyWeek team, to help you understand what really matters when it comes to your finances.
You are now subscribed
Your newsletter sign-up was successful
Want to add more newsletters?

Twice daily
MoneyWeek
Get the latest financial news, insights and expert analysis from our award-winning MoneyWeek team, to help you understand what really matters when it comes to your finances.

Four times a week
Look After My Bills
Sign up to our free money-saving newsletter, filled with the latest news and expert advice to help you find the best tips and deals for managing your bills. Start saving today!
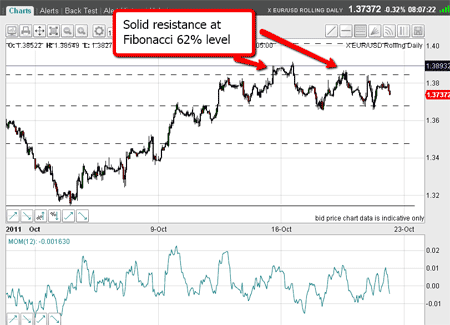
On Monday, I noted that the euro's sharp rally off the early October 1.32 low had taken the market to significant chart and Fibonacci resistance.
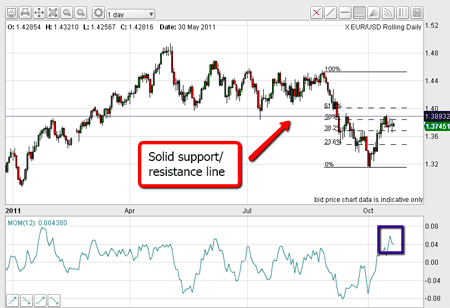
Below, you'll find the long-term daily chart of the euro vs the US dollar giving us the big picture.
The horizontal line at the 1.39 level represents solid support/resistance. Note, the line goes back to January. Since the summer, this line has held until the support gave way in early September, when the line became resistance to the rallies.
MoneyWeek
Subscribe to MoneyWeek today and get your first six magazine issues absolutely FREE

Sign up to Money Morning
Don't miss the latest investment and personal finances news, market analysis, plus money-saving tips with our free twice-daily newsletter
Don't miss the latest investment and personal finances news, market analysis, plus money-saving tips with our free twice-daily newsletter
This line of resistance was challenged on Monday again and it held.

(Click on the chart for a larger version)
Note also that the 1.39 level is near the Fibonacci 50% retrace level another line of resistance making this area a very formidable barrier to further rallies.
In addition, this latest rally has carried the momentum reading into very overbought territory as marked by the purple box.
The odds heavily favoured a top for this rally in the 1.39 area.
Trader tip: When so many elements come together, as here, selling into the rally is actually a low-risk trade. There are no guarantees, of course, but protective stops can be set quite tightly in these situations.
New tramlines offer tremendous shorting opportunities
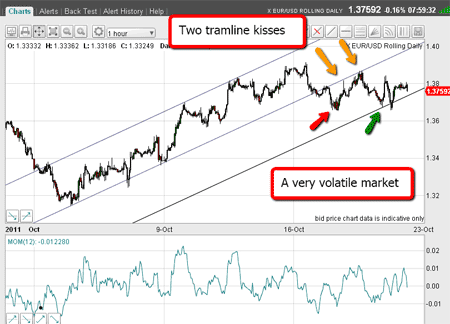
On Monday, I had a 'satellite' tramline, but now I can draw in a better-fitting set:

(Click on the chart for a larger version)
The upper one looks better, and so does the middle one and just admire the two 'kisses' as the market came back to the tramline underside (marked with yellow arrows).
These points were terrific shorting opportunities again affording a low-risk (tight stop) strategy.
With the two tramlines in place, I can now draw a lower equidistant tramline.
Following the second kiss, the market experienced a 'scalded cat bounce', thus giving me confidence in my short trade.
Trader tip: If trading a tramline 'kiss', I always look for a sharp move away from the tramline (the scalded cat bounce), as it usually means that my first target will be my lower tramline.
Sure enough, the market dropped right to my lower tramline yesterday (marked by green arrow). That was very pretty and a place to take profits on the short trades.
But with volatility already high, the market bounced sharply, but then zagged back down to touch the lower tramline and overshot it somewhat.
Trading here certainly requires nimble fingers on the mouse!
But where might the euro go now?
Since Monday, the market has traded in a consolidation zone:

(Click on the chart for a larger version)
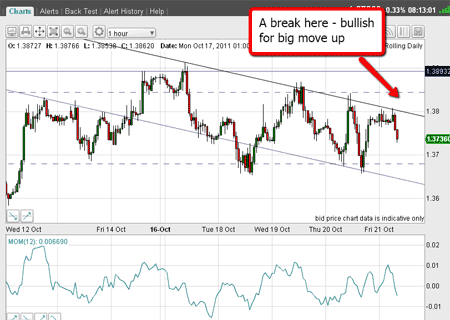
We have made lower highs since Monday, so let's see if I can draw in some down-sloping tramlines:

(Click on the chart for a larger version)
My upper tramline is pretty good, and so is my lower tramline. I like particularly the touch-point highs to the left of the chart.
This morning, the market rallied up to the upper tramline and is currently in the process of easing back down off it.
Since the market overwhelmingly expects the euro to decline, and because I am generally a contrarian trader, I am on the lookout for reasons why the euro can rally to confuse the majority.
But let's see what the market thinks. Here is the latest Commitments of Traders report.
| Hedge funds | 17,000 | 91,000 |
| Small traders | 35,000 | 62,000 |
| Total 52,000 | 52,000 | 153,000 |
| Row 3 - Cell 0 | Row 3 - Cell 1 | Row 3 - Cell 2 |
| Trade (banks, etc) | 170,000 | 69,000 |
Speculators, by a 3:1 majority, expect the euro to fall.
Remember the old market adage: "When something appears obvious to the majority, it is obviously wrong". But timing is everything.
I would say that if the market can rally past my upper tramline, that should propel it much higher towards the huge 1.39 resistance I have mentioned, perhaps and right through it?
This is an intriguing thought. That would place my original 1.40 Fibonacci target in the frame and set the 1.39 level as support.
But if not, my support level at the 1.3650 area would be worth watching. Breaking that would set the market back on the downward tack.
Meanwhile, the market will probably trade within its recent range until some market event occurs and that could happen at any time.
Prudence dictates that because the weekend could be a market-changer, evening up positions before today's close is the wisest strategy.
If you're a new reader, or need a reminder about some of the methods I refer to in my trades, then do have a look at my introductory videos:
The essentials of tramline trading
An introduction to Elliott wave theory
Don't miss my next trading insight. To receive all my spread betting blog posts by email, as soon as I've written them, just sign up here .
Get the latest financial news, insights and expert analysis from our award-winning MoneyWeek team, to help you understand what really matters when it comes to your finances.
John is is a British-born lapsed PhD physicist, who previously worked for Nasa on the Mars exploration team. He is a former commodity trading advisor with the US Commodities Futures Trading Commission, and worked in a boutique futures house in California in the 1980s.
He was a partner in one of the first futures newsletter advisory services, based in Washington DC, specialising in pork bellies and currencies. John is primarily a chart-reading trader, having cut his trading teeth in the days before PCs.
As well as his work in the financial world, he has launched, run and sold several 'real' businesses producing 'real' products.
-
 ISA fund and trust picks for every type of investor – which could work for you?
Whether you’re an ISA investor seeking reliable returns, looking to add a bit more risk to your portfolio or are new to investing, MoneyWeek asked the experts for funds and investment trusts you could consider in 2026
-
 The most popular fund sectors of 2025 as investor outflows continue
It was another difficult year for fund inflows but there are signs that investors are returning to the financial markets