Combining Fibonacci and Elliot waves in the euro
With so many traders piling into long positions on the euro, it's little wonder the market capsized, says John C Burford. Here, he uses two essential charting methods to set his next target.
Get the latest financial news, insights and expert analysis from our award-winning MoneyWeek team, to help you understand what really matters when it comes to your finances.
You are now subscribed
Your newsletter sign-up was successful
Want to add more newsletters?

Twice daily
MoneyWeek
Get the latest financial news, insights and expert analysis from our award-winning MoneyWeek team, to help you understand what really matters when it comes to your finances.

Four times a week
Look After My Bills
Sign up to our free money-saving newsletter, filled with the latest news and expert advice to help you find the best tips and deals for managing your bills. Start saving today!
The euro is crying out for coverage, since it has been rallying into major target areas recently.
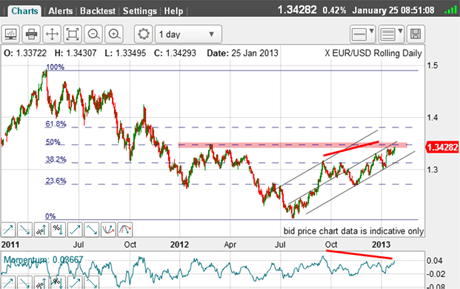
On 25 January, I noted that the market had reached the important 50% Fibonacci level(see chart below).
Not only that, the Commitments of Traders(COT) data showed that the speculators were piling into the long side with abandon.
MoneyWeek
Subscribe to MoneyWeek today and get your first six magazine issues absolutely FREE

Sign up to Money Morning
Don't miss the latest investment and personal finances news, market analysis, plus money-saving tips with our free twice-daily newsletter
Don't miss the latest investment and personal finances news, market analysis, plus money-saving tips with our free twice-daily newsletter
That was just one of the reasons I was wary of further gains.

(Click on the chart for a larger version)
However, I also noted that the trend was still up, and that was the correct direction to trade as of then.
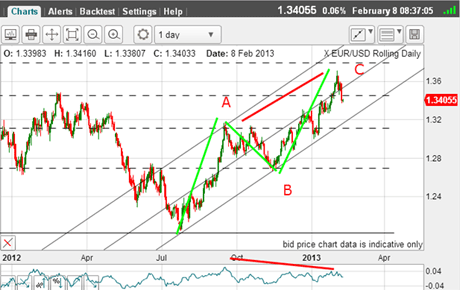
The rally did continue and surged to the 1.37 level on 1 February, just missing the next Fibonacci level at 62%:

(Click on the chart for a larger version)
The A-B-C pattern was still valid, which meant I was looking for a top and a resumption of the bear market.
Also, the large potential negative-momentum divergence was still in play (red bars). This was a potentially bearish sign, of course.
But this week, the market has plunged right back down below my central tramline. This is important, since it indicates my tramlines are much less valid.
I must look for another set and abandon this one! Remember, tramlines do not live forever.
Re-drawing Fibonacci
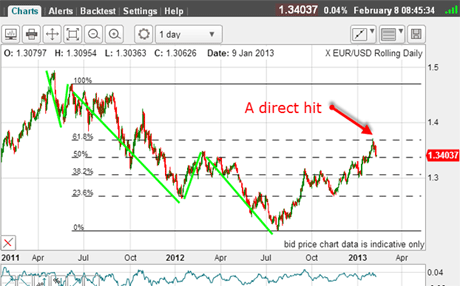
Another interesting feature is this: although the 1.37 top missed the Fibonacci 62% level using the current pivot points, see what happens if, instead of using the May 2011 top as my high pivot point, I use the next high:

(Click on the chart for a larger version)
My high pivot point is now the wave 2 high of the major bear market five-wave pattern and I score a direct hit on the Fibonacci 62% retrace!
Trader tip: When looking for Fibonacci pivot points, if you believe you have a five-wave pattern that obeys all of the Elliott wave rules (as this one does), play with the wave 2 high/low and draw in an alternative Fibonacci set. This is an important area I teach in depth in my workshops.
So now, since the May 2011 top, I have a five-wave pattern down, followed by a three wave A-B-C pattern up.
This is textbook Elliott wave behaviour, and indicates the larger trend is down.
If last Friday's 1.37 is the C wave top, what is the prognosis for the likely extent of the move down?
Let's have a look at the latest COT data as of 29 January:
| OPEN INTEREST: 237,856 | ||||||||
| COMMITMENTS | ||||||||
| 93,791 | 66,319 | 4,668 | 81,422 | 116,865 | 179,881 | 187,852 | 57,975 | 50,004 |
| CHANGES FROM01/22/13 (CHANGE IN OPEN INTEREST: 21,797) | ||||||||
| 9,951 | 3,860 | 861 | 6,714 | 14,509 | 17,526 | 19,230 | 4,271 | 2,567 |
| PERCENT OF OPEN INTEREST FOR EACH CATEGORY OF TRADERS | ||||||||
| 39.4 | 27.9 | 2.0 | 34.2 | 49.1 | 75.6 | 79.0 | 24.4 | 21.0 |
| NUMBER OF TRADERS IN EACH CATEGORY (TOTAL TRADERS: 178) | ||||||||
| 57 | 51 | 19 | 44 | 47 | 108 | 110 | Row 8 - Cell 7 | Row 8 - Cell 8 |
Totally predictably, the speculators have increased their long positions, while the commercials have taken the other side of the bet.
So the trap has been sprung on the euro bulls!
Interestingly, the huge sell-off yesterday supposedly was prompted by a remark that MarioDraghi, the ECB president made. I took the trouble to read what he had to say. It was total central bank nudge nudge, wink wink language. He must have taken lessons from Alan Greenspan, the master of arcane pronouncements.
No, the real reason the market fell heavily was the excess of bullish sentiment which tipped the boat over.
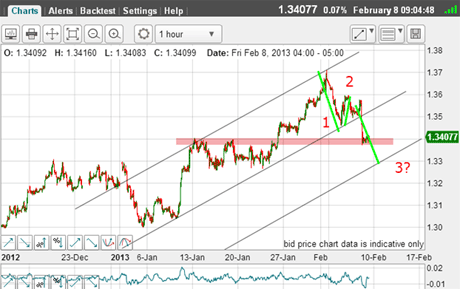
Now, let's look at the hourly chart:

(Click on the chart for a larger version)
I have a superb central tramline with several touch points which was well and truly broken yesterday. My upper tramline likewise is excellent, with a nice prior pivot point(PPP) and the two major highs.
That means my equidistant lowest tramline is my next target.
Yesterday's sell-off was impulsive, and that makes me think we are in a third wave (green bars), which could end at or around the lowest tramline.
But first, the market should be able to stage a bounce from current levels since it is hitting a support zone (pink bar). It may even attempt a rally back to the underside of the central tramline in a traditional kiss. I shall be on the lookout for this.
Of course, the market may decide to plough right through this support and make a dash for the lowest tramline.
The alternative scenario is that the move off the 1.37 high is a three-wave A-B-C, implying a resumption of the uptrend. But without a positive-momentum divergence, I am less inclined to this view, although a valid one.
If you're a new reader, or need a reminder about some of the methods I refer to in my trades, then do have a look at my introductory videos:
The essentials of tramline trading
An introduction to Elliott wave theory
Advanced trading with Elliott waves
Don't miss my next trading insight. To receive all my spread betting blog posts by email, as soon as I've written them, just sign up here . If you have any queries regarding MoneyWeek Trader, please contact us here.
Get the latest financial news, insights and expert analysis from our award-winning MoneyWeek team, to help you understand what really matters when it comes to your finances.
John is is a British-born lapsed PhD physicist, who previously worked for Nasa on the Mars exploration team. He is a former commodity trading advisor with the US Commodities Futures Trading Commission, and worked in a boutique futures house in California in the 1980s.
He was a partner in one of the first futures newsletter advisory services, based in Washington DC, specialising in pork bellies and currencies. John is primarily a chart-reading trader, having cut his trading teeth in the days before PCs.
As well as his work in the financial world, he has launched, run and sold several 'real' businesses producing 'real' products.
-
 How should a good Catholic invest? Like the Vatican’s new stock index, it seems
The Vatican Bank has launched its first-ever stock index, championing companies that align with “Catholic principles”. But how well would it perform?
-
 The most single-friendly areas to buy a property
There can be a single premium when it comes to getting on the property ladder but Zoopla has identified parts of the UK that remain affordable if you aren’t coupled-up