This market is trending upwards
Speculators on the euro have placed their bets on the currency rising. John C Burford uses his trading methods to see if the charts agree.
Get the latest financial news, insights and expert analysis from our award-winning MoneyWeek team, to help you understand what really matters when it comes to your finances.
You are now subscribed
Your newsletter sign-up was successful
Want to add more newsletters?

Twice daily
MoneyWeek
Get the latest financial news, insights and expert analysis from our award-winning MoneyWeek team, to help you understand what really matters when it comes to your finances.

Four times a week
Look After My Bills
Sign up to our free money-saving newsletter, filled with the latest news and expert advice to help you find the best tips and deals for managing your bills. Start saving today!
TABLE.ben-table TABLE {BORDER-BOTTOM: #2b1083 1px solid; BORDER-LEFT: #2b1083 1px solid; BORDER-TOP: #2b1083 1px solid; BORDER-RIGHT: #2b1083 1px solid}TH {TEXT-ALIGN: center; BORDER-LEFT: #a6a6c9 1px solid; PADDING-BOTTOM: 2px; PADDING-LEFT: 1px; PADDING-RIGHT: 1px; BACKGROUND: #2b1083; COLOR: white; FONT-SIZE: 0.8em; FONT-WEIGHT: bold; PADDING-TOP: 2px}TH.first {TEXT-ALIGN: left; BORDER-LEFT: 0px; PADDING-BOTTOM: 2px; PADDING-LEFT: 1px; PADDING-RIGHT: 1px; FONT-SIZE: 0.8em; PADDING-TOP: 2px}TR {BACKGROUND: #fff}TR.alt {BACKGROUND: #f6f5f9}TD {TEXT-ALIGN: center; BORDER-LEFT: #a6a6c9 1px solid; PADDING-BOTTOM: 2px; PADDING-LEFT: 1px; PADDING-RIGHT: 1px; COLOR: #000; FONT-SIZE: 0.8em; PADDING-TOP: 2px}TD.alt {BACKGROUND-COLOR: #f6f5f9}TD.bold {FONT-WEIGHT: bold}TD.first {TEXT-ALIGN: left}TD.left {TEXT-ALIGN: left}TD.bleft {TEXT-ALIGN: left; FONT-WEIGHT: bold}
I last covered the euro on 14 January - "Can the euro continue its rally?" - and since then, the answer has been a definite "yes".
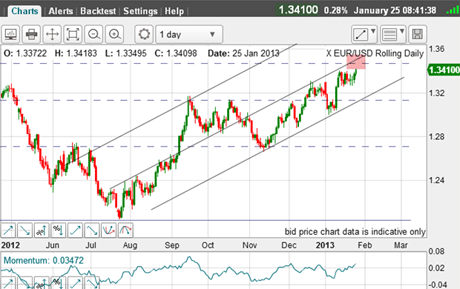
On Jan 14, the euro was challenging the 1.34 level and bouncing off a tramline. The market overnight has succeeded in moving through 1.34 seethe current chart below.
MoneyWeek
Subscribe to MoneyWeek today and get your first six magazine issues absolutely FREE

Sign up to Money Morning
Don't miss the latest investment and personal finances news, market analysis, plus money-saving tips with our free twice-daily newsletter
Don't miss the latest investment and personal finances news, market analysis, plus money-saving tips with our free twice-daily newsletter
I now have my third tramline placed above the original pair I showed last time.It's not completely reliable with only two touch points so far.

(Click on the chart for a larger version)
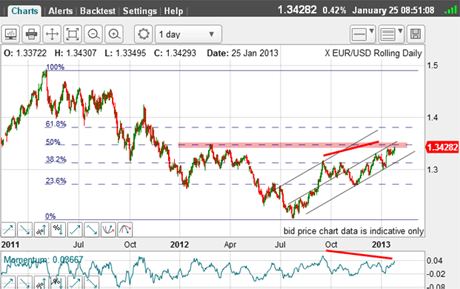
The crucial Fibonacci 50% retrace of the big swing down off the 1.50 high in May 2011 to the 1.20 low in July 2012 lies directly ahead.
Note that this level at the 1.3480 area was major resistance in February last year, and lies only 40 pips away from the current market as I write.Here is the long-term view:

(Click on the chart for a larger version)
I have highlighted this zone of resistance.
If you glance at my first chart, you will see that we are approaching the crossing of the 50% level and my tramline (pink bar).There should be strong resistance here.
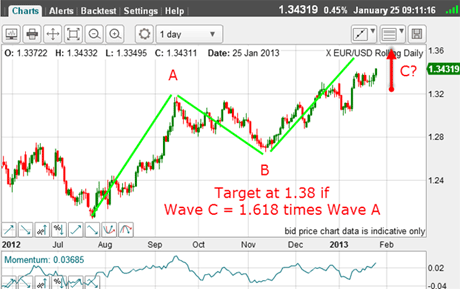
OK, now I have a possible scenario. And to add to the picture, there is a clear A-B-C form to the rally off last year's 1.20 low a potentially bearish sign.The key, of course, is in identifying where the C wave will end a tough assignment!
In addition, there is a potential negative-momentum divergence forming (red lines).
Building a case with COT data
Let's see if the Commitments of Traders(COT) data has anything to say about this.Here are the latest data as of 15 January:
| OPEN INTEREST: 211,373 | ||||||||
| COMMITMENTS | ||||||||
| 80,174 | 72,859 | 2,810 | 73,119 | 88,184 | 156,103 | 163,853 | 55,270 | 47,520 |
| CHANGES FROM 01/08/13 (CHANGE IN OPEN INTEREST: 17,122) | ||||||||
| 13,845 | -1,505 | 85 | -4,182 | 20,355 | 9,748 | 18,935 | 7,374 | -1,813 |
| PERCENT OF OPEN INTEREST FOR EACH CATEGORY OF TRADERS | ||||||||
| 37.9 | 34.5 | 1.3 | 34.6 | 41.7 | 73.9 | 77.5 | 26.1 | 22.5 |
| NUMBER OF TRADERS IN EACH CATEGORY (TOTAL TRADERS: 180) | ||||||||
| 56 | 50 | 22 | 46 | 49 | 110 | 113 | Row 8 - Cell 7 | Row 8 - Cell 8 |
This period covers the week up to 15 January just after my previous post.
The hedgies (non-commercials) have ramped up their bullish stance and the banks and trade (commercials) have massively increased their short stance.The small traders (non-reportables) have likewise increased their long positions.
Following that data point, the market swung down around 150 pips in its consolidation phase before moving back up.
The end result? The speculators ramped up their long positions in anticipation of the rally continuing.
So what are the odds of this occurring?
Time to look at the Elliott waves:

(Click on the chart for a larger version)
I mentioned before that it appears the rally off the 1.20 low is an A-B-C.
It is often found that when the C wave is extended, it reaches a Fibonacci 1.618 times the extent of the A wave.That would put the target at the 1.38 area for the turn.
Currently, the C wave is slightly longer than the A wave.I should also point out that equality too is a common Fibonacci relationship!
Not coincidentally, the 1.38 area is also the Fibonacci 62% retrace of the big wave down (see second chart).
That would be a terrific target, but it must first navigate the 50% resistance area just ahead.
But the trend is firmly up. That is the direction best traded.
If you're a new reader, or need a reminder about some of the methods I refer to in my trades, then do have a look at my introductory videos:
The essentials of tramline trading
An introduction to Elliott wave theory
Advanced trading with Elliott waves
Don't miss my next trading insight. To receive all my spread betting blog posts by email, as soon as I've written them, just sign up here . If you have any queries regarding MoneyWeek Trader, please contact us here.
Get the latest financial news, insights and expert analysis from our award-winning MoneyWeek team, to help you understand what really matters when it comes to your finances.
John is is a British-born lapsed PhD physicist, who previously worked for Nasa on the Mars exploration team. He is a former commodity trading advisor with the US Commodities Futures Trading Commission, and worked in a boutique futures house in California in the 1980s.
He was a partner in one of the first futures newsletter advisory services, based in Washington DC, specialising in pork bellies and currencies. John is primarily a chart-reading trader, having cut his trading teeth in the days before PCs.
As well as his work in the financial world, he has launched, run and sold several 'real' businesses producing 'real' products.
-
 Average UK house price reaches £300,000 for first time, Halifax says
While the average house price has topped £300k, regional disparities still remain, Halifax finds.
-
 Barings Emerging Europe trust bounces back from Russia woes
Barings Emerging Europe trust has added the Middle East and Africa to its mandate, delivering a strong recovery, says Max King