You are now subscribed
Your newsletter sign-up was successful
Want to add more newsletters?

Twice daily
MoneyWeek
Get the latest financial news, insights and expert analysis from our award-winning MoneyWeek team, to help you understand what really matters when it comes to your finances.

Four times a week
Look After My Bills
Sign up to our free money-saving newsletter, filled with the latest news and expert advice to help you find the best tips and deals for managing your bills. Start saving today!
table.ben-table table { border: 1px solid #2b1083;font: verdana, arial, sans-serif; }
th { background: #2b1083; padding: 2px 1px;color: white;font-weight: bold;text-align: center;border-left: 1px solid #a6a6c9; font-size: .8em;}th.first { border-left: 0; padding: 2px 1px;text-align: left; font-size: .8em;}
MoneyWeek
Subscribe to MoneyWeek today and get your first six magazine issues absolutely FREE

Sign up to Money Morning
Don't miss the latest investment and personal finances news, market analysis, plus money-saving tips with our free twice-daily newsletter
Don't miss the latest investment and personal finances news, market analysis, plus money-saving tips with our free twice-daily newsletter
tr.alt {background: #f6f5f9; }
td { padding: 2px 1px;text-align: center;border-left: 1px solid #a6a6c9;color: #000;vertical-align: center; font-size: .8em;}td.alt { background-color: #f6f5f9; }
td.bold { font-weight: bold;}td.first { text-align: left; }
td.left { text-align: left; }
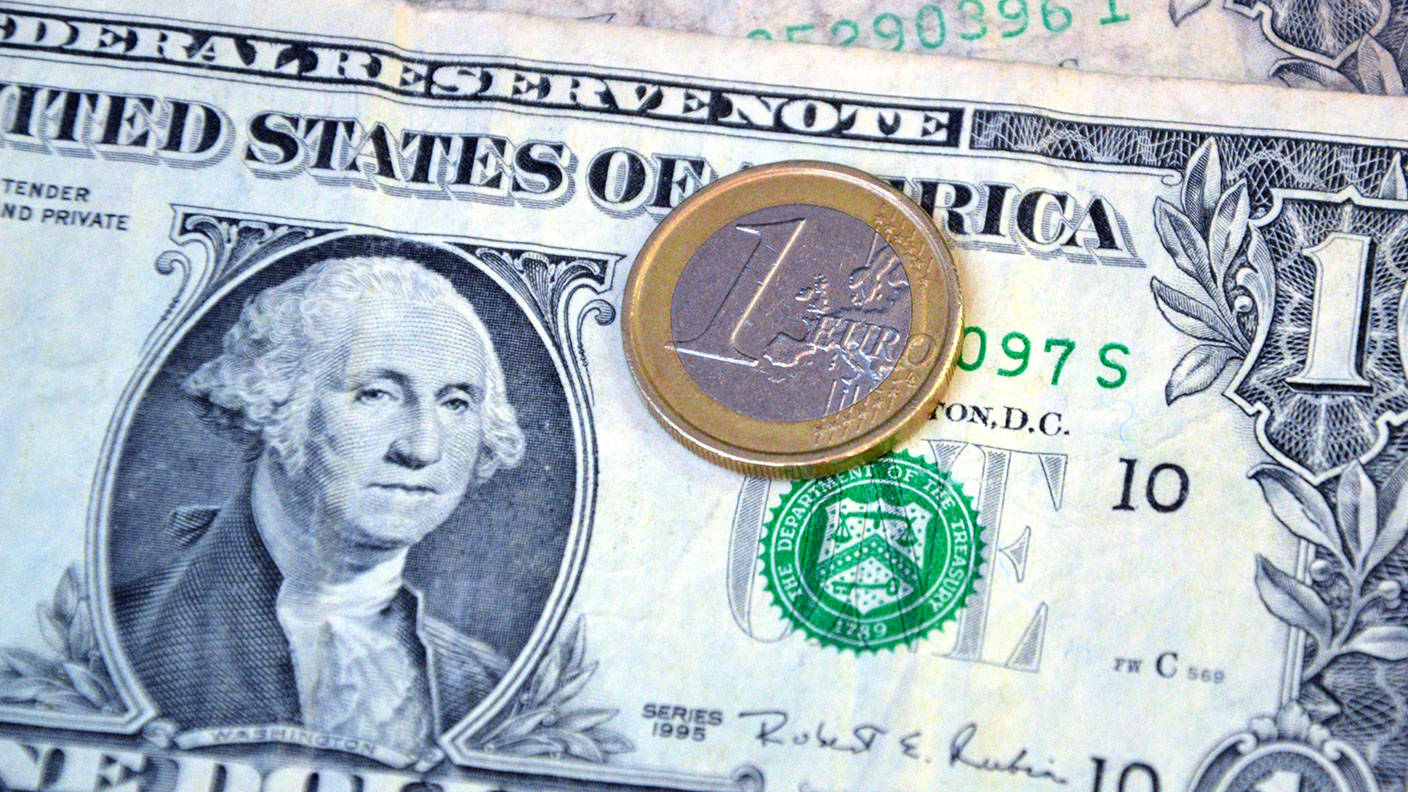
Today I will follow up the euro story from Friday as it is a classic illustration of how I trade from charts and not the news.
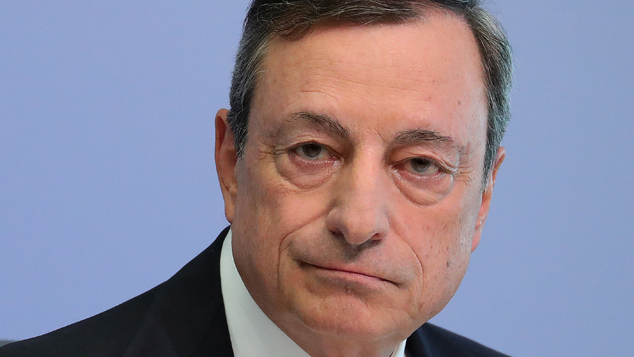
Many observers are saying that the huge rally off last week's 1.30 low is attributable to some comments that Mario Draghi the European Central Bank president made concerning his view that the high and rising eurozone unemployment data was not the result of the ECB money-printing and asset purchase programme. Ha.
The policy interest rate was left unchanged again. The conventional take after the rally, of course is that the statement was bullish for the euro. Therefore, all anyone needed to do was wait for this statement to be released, and hey presto buy the euro.
If life were this simple, none of you would be reading my posts!
The market exists to confound the majority
My view is that the news follows the markets, not the reverse.
Whenever I encounter a trader who dismisses technical analysis but trades off the fundamentals', I ask "So how do you decide whether a piece of news is bullish or bearish what is your methodology?" I usually receive a mixed message.
No, the sharp rally following Draghi's statement was partly caused by short covering the market has been generally bearish on the euro for a long time, as forecasts of a break-up have been rife.
And leading up to the Draghi statement, there was a radical shift in futures positions:
| (CONTRACTS OF EUR 125,000) OPEN INTEREST: 194,251 | ||||||||
| COMMITMENTS | ||||||||
| 66,329 | 74,364 | 2,725 | 77,301 | 67,829 | 146,355 | 144,918 | 47,896 | 49,333 |
| CHANGES FROM 31/12/12 (CHANGE IN OPEN INTEREST: -13,357) | ||||||||
| -15,603 | -2,442 | -244 | 5,410 | -14,652 | -10,437 | -17,338 | -2,920 | 3,981 |
| PERCENT OF OPEN INTEREST FOR EACH CATEGORY OF TRADERS | ||||||||
| 13.1 | 38.3 | 1.4 | 39.8 | 34.9 | 75.3 | 74.6 | 24.7 | 25.4 |
| NUMBER OF TRADERS IN EACH CATEGORY (TOTAL TRADERS: 170) | ||||||||
| 42 | 59 | 17 | 43 | 43 | 94 | 110 | Row 8 - Cell 7 | Row 8 - Cell 8 |
The hedge funds (large non-commercials) dumped many more long positions than short. Also, the commercials (smart money) increased their longs and heavily dropped their shorts in the most recent week. The swing was a massive 27% to the bull side. Maybe the banks had an inkling what was in the statement! Is it possible that there is collusion?
So the speculators then were positioning for a bear move and a bearish reaction to Draghi.
But after they had done that, the market caught fire! How's that for timing and poor forecasting?
My take on this? The market, which was caught flat-footed with too many shorts, was vulnerable to a short squeeze.
Remember the old adage that the market exists to confound the majority?
The bottom line is this: I advise all traders to monitor sentiment and Commitments of Traders(COT) data and look to trade opposite to the herd. That is where the profits lie.
On Friday, I showed my working up-sloping tramlines:
(Click on the chart for a larger version)
And my immediate target was the upper line in the pink zone.
And here is that chart updated to this morning:
(Click on the chart for a larger version)
Overnight, the market reached 1.34, making that a hit, depending on exactly where you place the upper tramline.
But I also have a long-term tramline pair working:
(Click on the chart for a larger version)
This is the daily chart going back to the prior pivot point(PPP) in October/November 2010.
The market has clearly broken above my centre line and is heading towards my upper line in the pink zone.
The Fibonacci 50% retrace level in the 134.50 to 1.35 area lies directly ahead and should provide huge resistance (as it did in late February 2012).
That means progress from here should be a lot more difficult.
The importance of trade timing
These are exciting times in the euro and using my trading methods, good profits are being made.
Trying to figure out the market direction from the economic data is a fool's errand in my view.
For one thing, there is a mountain of relevant data out there, much of which is contradictory hence the acres of newsprint devoted to analysing' it.
And for another, we are dealing with a leveraged product when we spread bet.That makes the timing of trade entries of critical significance.
No fundamental analysis is of any use in this area.
That is why I have developed trade timing to such an exacting degree.
If you're a new reader, or need a reminder about some of the methods I refer to in my trades, then do have a look at my introductory videos:
The essentials of tramline trading
An introduction to Elliott wave theory
Advanced trading with Elliott waves
Don't miss my next trading insight. To receive all my spread betting blog posts by email, as soon as I've written them, just sign up here . If you have any queries regarding MoneyWeek Trader, please contact us here.
-
 Average UK house price reaches £300,000 for first time, Halifax says
While the average house price has topped £300k, regional disparities still remain, Halifax finds.
-
 Barings Emerging Europe trust bounces back from Russia woes
Barings Emerging Europe trust has added the Middle East and Africa to its mandate, delivering a strong recovery, says Max King


-
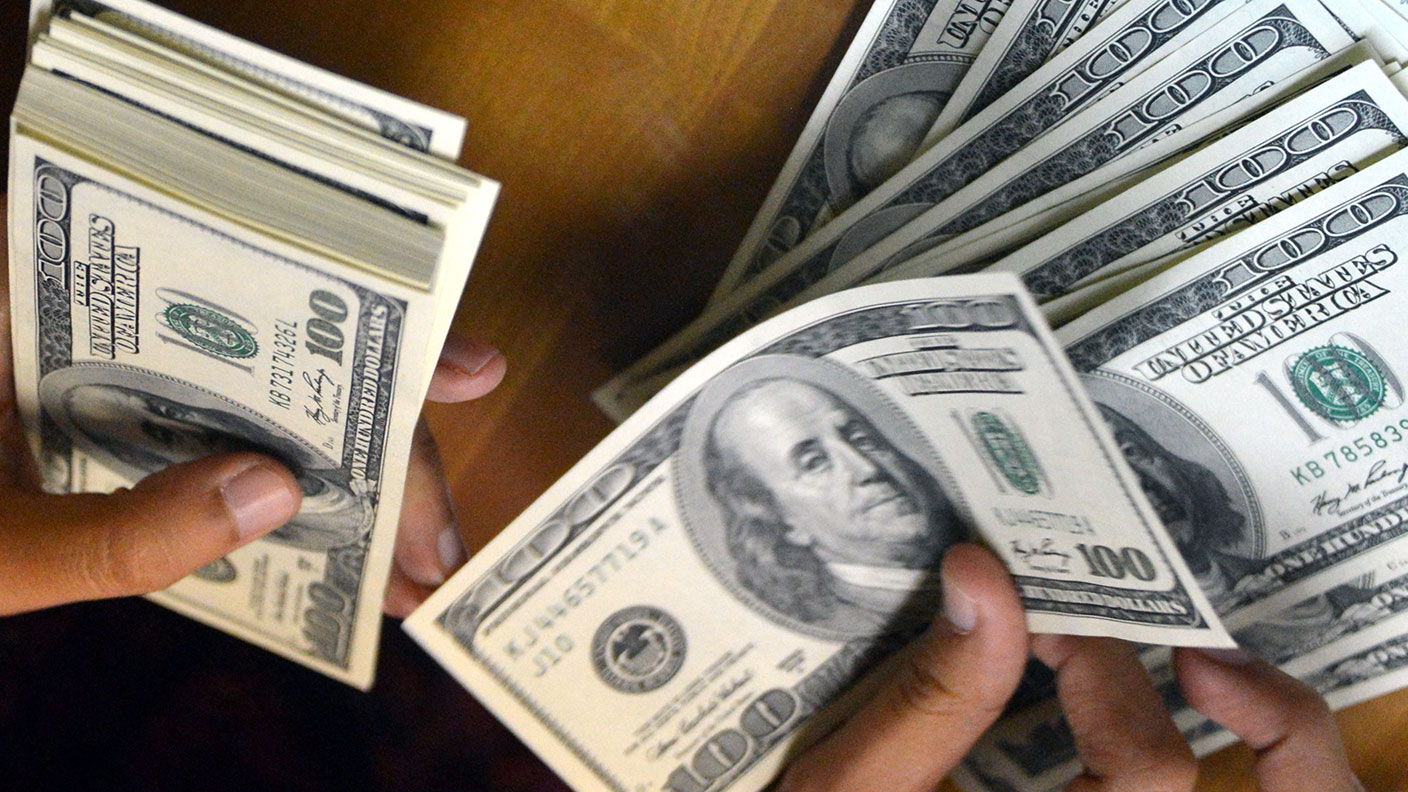
 Investors dash into the US dollar
News The value of the US dollar has soared as investors pile in. The euro has hit parity, while the Japanese yen and the Swedish krona have fared even worse.
-
 Could a stronger euro bring relief to global markets?
Analysis The European Central Bank is set to end its negative interest rate policy. That should bring some relief to markets, says John Stepek. Here’s why.
-
 A weakening US dollar is good news for markets – but will it continue?
Opinion The US dollar – the most important currency in the world – is on the slide. And that's good news for the stockmarket rally. John Stepek looks at what could derail things.
-
 How the US dollar standard is now suffocating the global economy
News In times of crisis, everyone wants cash. But not just any cash – they want the US dollar. John Stepek explains why the rush for dollars is putting a big dent in an already fragile global economy.
-
 The pound could hit parity with the euro – but if it does, buy it
Features Anyone visiting the continent this summer will have been in for a rude shock at the cash till, says Dominic Frisby. But the pound won't stay down forever.
-
 Gold’s rally should continue
Features Matthew Partridge looks at where the gold price is heading next, and what that means for your online trading.
-
 Prudent trades in Prudential
Features John C Burford shows how his trading methods can be used for more than just indices and currencies. They work for large-cap shares too.
-
 Did you find the path of least resistance in EUR/USD?
Features John C Burford outlines a trade in the euro vs the dollar in the wake of the US Federal Reserve’s most recent announcement.


