You are now subscribed
Your newsletter sign-up was successful
Want to add more newsletters?

Twice daily
MoneyWeek
Get the latest financial news, insights and expert analysis from our award-winning MoneyWeek team, to help you understand what really matters when it comes to your finances.

Four times a week
Look After My Bills
Sign up to our free money-saving newsletter, filled with the latest news and expert advice to help you find the best tips and deals for managing your bills. Start saving today!
This is interesting
At last week's workshop, most attendees told me they really appreciated working on finding tramlines on real-time charts with my guidance.
MoneyWeek
Subscribe to MoneyWeek today and get your first six magazine issues absolutely FREE

Sign up to Money Morning
Don't miss the latest investment and personal finances news, market analysis, plus money-saving tips with our free twice-daily newsletter
Don't miss the latest investment and personal finances news, market analysis, plus money-saving tips with our free twice-daily newsletter
But the point is, practising finding these tramlines with my help really helped people get to grips with my strategy. And that made us all feel great.
I'm now more confident than ever that I can help people learn how to take a meaningful income from the markets using the strategy I've developed.
That's what MoneyWeek Trader is about so do keep practising each time I write and let me know how you get on.
Something a little different for today
Let's practise some tramline trading
Tramline trading is the one strategy I employ most often myself. So I thought today I'd pull up a few current charts of my favourite markets and analyse the tramlines. It should be a great way for you to see how I use them. Then, why not practise finding some of your own?
I suggest you study each chart and satisfy yourself that I have drawn in some valid tramlines complete with many prior pivot points (PPPs) and touch-points.
If you can find other tramlines working on the same charts, as we did at the workshop, by all means use those.
Incidentally, I promised you further coverage of the EUR/USD, following our workshop trade and I will get to it next week. In the meantime, I do have a fascinating euro chart to show today. We'll get to that in a minute.
But I want to look at a few others first. Remember, none of these are recommendations for trades I'm just showing you what I look for and what I see.
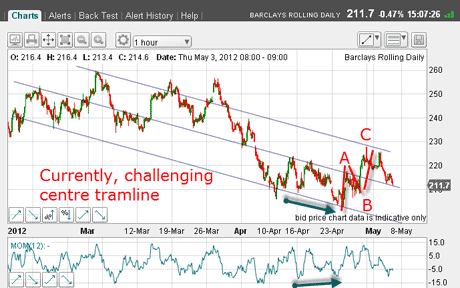
At the workshop, I used the Barclays chart extensively as a terrific example of how I use tramlines, Fibonaccis, and Elliott waves and momentum divergences to spot really solid trades.
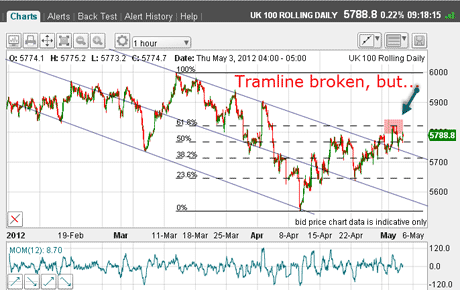
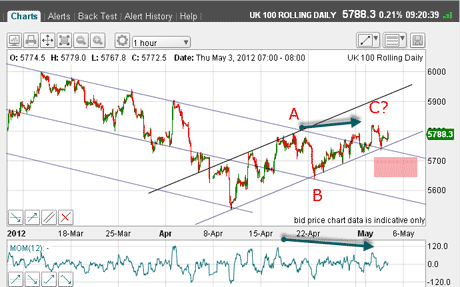
Here is the hourly chart:
(Click on the chart for a larger version)
From a Fibonacci retrace on the daily chart, I spotted a low-risk trade shorting it at the 260p level in March. Since then, the market has declined along my tramline trio.
The 205p low made on 24 April was reversed on the lower tramline (a downside target) and on a positive momentum divergence (green arrows). Incidentally, can you spot the lovely five-wave move down from the 27 March high?
There followed a normal A-B-C rally with the C wave topping right at the highest tramline, as per the textbook.
Further short positions could then be taken at the C wave top. The market is declining now and as I write, is challenging the centre tramline. Will it break through support?
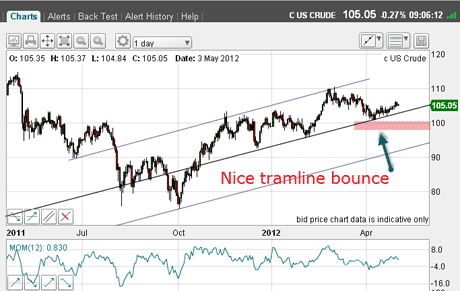
US crude oil
I looked at this market a few days ago and here is the daily chart updated. The market has rallied somewhat in line with the Dow they move more or less in synch, contrary to popular opinion but any Dow weakness would likely provoke a break of the centre tramline.
(Click on the chart for a larger version)
The pink bar indicates the area where I might consider sell-stops to enter short positions, anticipating a break.
If this occurs, my first target would be the lowest tramline.
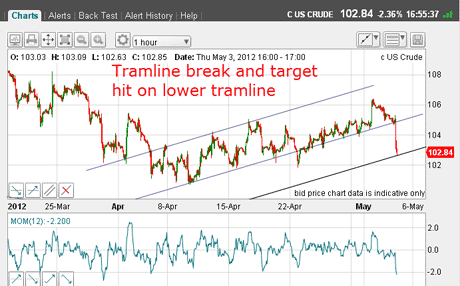
But here is the hourly chart showing good tramlines:
(Click on the chart for a larger version)
We have a sharp centre tramline break and a hit on the third tramline as I write. That is my short-term target for taking profits. A break here would be very bearish.
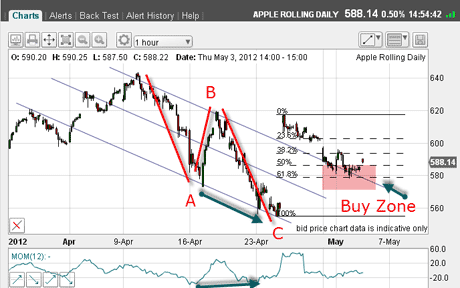
The darling of the Nasdaq! And who does not love Apple products? I have been tracking Apple for some time and watched as it sailed above the $600 mark in early April to cap a staggering rally.
At the workshop, I discussed this chart as it was very popular in the room!
(Click on the chart for a larger version)
Many investors decided to take profits ahead of the critical earnings report and the decline followed a classic A-B-C with a positive momentum divergence at the C wave low. That was a beaut of a buy signal.
The stellar earnings report shook out many shorts with a $60 gap opening and the market has been trying to fill the gap ever since.
But look at my tramlines aren't they pretty?
On these occasions, I like to apply my Fibonacci and lo and behold, the market yesterday made an exact 62% retrace right on my upper tramline. That is a buy zone for me and at low-risk, because if the market does decline below the $580 level, it could be protected with a close stop.
Here are my lovely tramlines on the hourly chart and the market is deciding whether to have a head-fake, or to make this a genuine upside break.
The Fibonacci 62% level has been hit and the market is hesitating here, so it's time to look at the short-term picture:
(Click on the chart for a larger version)
The rally has a potential A-B-C feel with a potential negative momentum divergence. If the market is unable to make progress from here, the head-fake interpretation becomes compelling.
The pink bar in the next chart indicates the area that would indicate short positions, anticipating a tramline break in synch with the Dow.
(Click on the chart for a larger version)
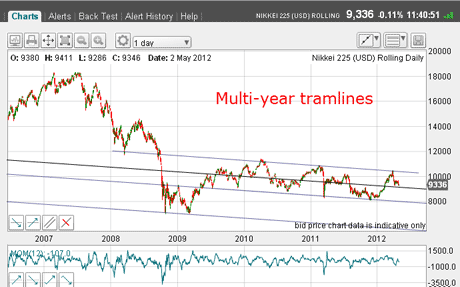
Nikkei
I covered this a few days ago and this is the updated daily chart:
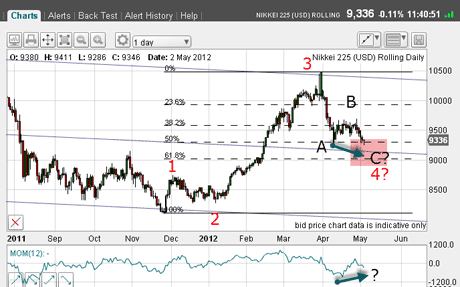
(Click on the chart for a larger version)
The short-term picture is interesting. From the low in December, I can count a nice Elliott wave pattern waves 1,2,3 ( long and strong), and we may be forming a wave 4.
(Click on the chart for a larger version)
The Fibonacci 50% is being challenged for a second time, so a move to the 62% is probable. That would set up a lovely A-B-C on a positive momentum divergence.
The alternative message is that we are in an extended C wave, which could reach the lower tramline.
But the 62% level is where there resides solid chart support from the August December period.
EUR/USD
This is the hourly chart for the past few days and shows a good 5-wave decline from the 1.3280 high. And note the positive momentum divergence at wave 5. A rally is indicated hopefully in an A-B-C.
Also, wave 5 has landed on a Fibonacci retrace.
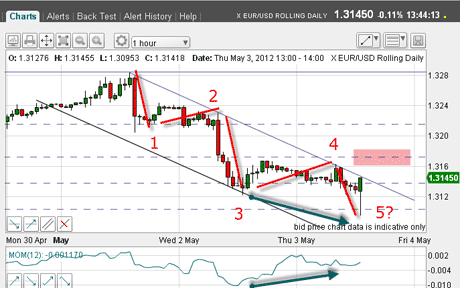
(Click on the chart for a larger version)
As I write, the market has just broken above the tramline, so I have drawn in a third tramline and a new set of Fibonacci targets:
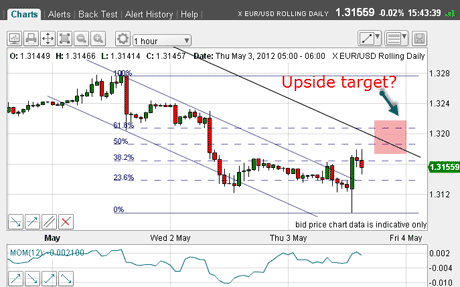
(Click on the chart for a larger version)
The market is declining to try to kiss the centre tramline. I wonder if it could be a good spot for a short-term long trade. Could there be an A-B-C up ahead?
One possible target I'm looking at is indicated by the pink bar. But with the larger trend now down as indicated by the five-wave pattern a better longer-term play would be selling into rallies. That's what I'm thinking now.
If you're a new reader, or need a reminder about some of the methods I refer to in my trades, then do have a look at my introductory videos:
The essentials of tramline trading
An introduction to Elliott wave theory
Advanced trading with Elliott waves
Don't miss my next trading insight. To receive all my spread betting blog posts by email, as soon as I've written them, just sign up here .
-
 ISA fund and trust picks for every type of investor – which could work for you?
Whether you’re an ISA investor seeking reliable returns, looking to add a bit more risk to your portfolio or are new to investing, MoneyWeek asked the experts for funds and investment trusts you could consider in 2026
-
 The most popular fund sectors of 2025 as investor outflows continue
It was another difficult year for fund inflows but there are signs that investors are returning to the financial markets

