This chart says the Dow is about to break out
The Dow Jones is trapped between two tramlines, says John C Burford. It will escape at some point – but which way?
Get the latest financial news, insights and expert analysis from our award-winning MoneyWeek team, to help you understand what really matters when it comes to your finances.
You are now subscribed
Your newsletter sign-up was successful
Want to add more newsletters?

Twice daily
MoneyWeek
Get the latest financial news, insights and expert analysis from our award-winning MoneyWeek team, to help you understand what really matters when it comes to your finances.

Four times a week
Look After My Bills
Sign up to our free money-saving newsletter, filled with the latest news and expert advice to help you find the best tips and deals for managing your bills. Start saving today!
I'm going to show you the latest charts on the Dow in a minute. Things are getting really exciting now! You should see the absolute beauty of a tramlineI've just drawn in. More on that below.
But first, a quick detour
Since it's Friday, I thought I'd give you a bonus and show you a very pretty tramline set-up in one of the most important world markets crude oil.
MoneyWeek
Subscribe to MoneyWeek today and get your first six magazine issues absolutely FREE

Sign up to Money Morning
Don't miss the latest investment and personal finances news, market analysis, plus money-saving tips with our free twice-daily newsletter
Don't miss the latest investment and personal finances news, market analysis, plus money-saving tips with our free twice-daily newsletter
I'm sure many readers follow and perhaps trade this market either the US market or Brent. If you do, you'll know it's one of the trickiest markets out there!
Sharp spikes are common in the oil market, even more so than in gold. And stops are vulnerable to being picked off with the market resuming in your direction thereafter. It can be incredibly frustrating, and frankly I find it too demanding to trade using my swing trading methods.
A textbook tramline setup in the oil market
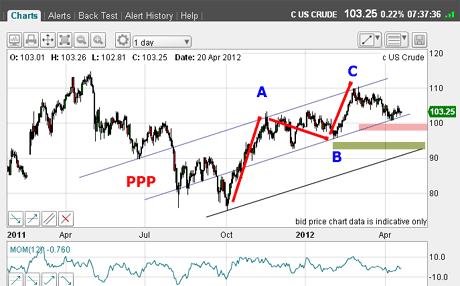
But the picture today is intriguing and a great lesson in tramlines. Here's the latest daily chart:

(Click on the chart for a larger version)
The high at $115 was made last May and after that the market declined to the October $75 low coincident with the Dow low. Since then, it's rallied back to the $110 level in three clear waves an A-B-C pattern.
Also, just look at those convincing tramlines I've been able to draw!
The first is the upper one with the lovely 'prior pivot point' (PPP), which lies across the A and C wave tops.
Then I drew the central line which contains several good touch-points. And finally, I drew the lowest equidistant tramline and it nicely passes through the October low.
Tramlines do not come more textbook than this.
If the market can break the centre tramline, my strategy might be to place a sell order around the pink bar just beneath $100. A confirmation of trend change would come if the B wave low can be breached (green bar).
Naturally, the market could just as well bounce off this central tramline and stay within the trading channel. Like I said, it's a tricky market and it's easy to be wrong-footed! Let's see what happens
Now let's get back to the Dow.
The Dow bounces off support and edges higher
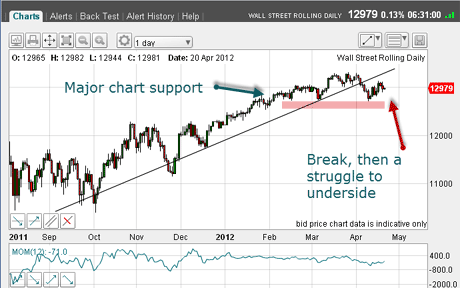
On the daily chart, the market has made a clear break of the wedge trendline with a rally off major chart support (marked by pink bar):

(Click on the chart for a larger version)
Normally, I would expect the rally to carry to the underside of the tramline, but with the clear A-B-C in place, that appears unlikely. If so, that would spell trouble for the bulls.
When I left it on Wednesday, the market had rallied to the 13,100 area in an A-B-C form. I thought then that there was a chance for it to rally a little further to the 13,250 area, considering the massive swing in investor sentiment that had occurred the previous week (I am still reeling from this data!)
But I considered this less likely than a decline off my C wave top and this is why.
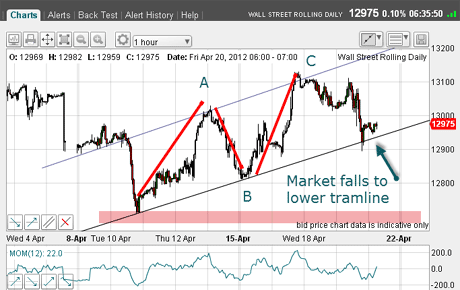
I can now draw in a very tasty pair of tramlines containing the A-B-C pattern:

(Click on the chart for a larger version)
I have a super upper tramline with a PPP can you spot it? and hitting the A and C wave tops.
My lower tramline takes in the two lows including the B wave low.
Since Wednesday, the market has declined off the C wave high, but in a highly volatile fashion. Yesterday, in particular, was very choppy.
But this volatility is what I expected, as I pointed out on Wednesday, as the bulls and the new bears slug it out. Round 1 to the bears!
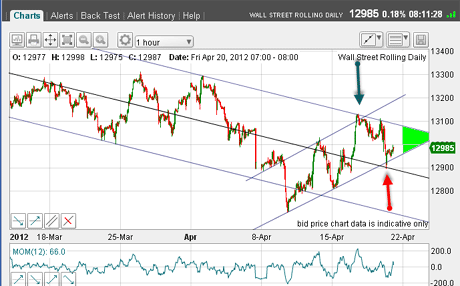
Now with the market bouncing off the lower tramline, can I glean anything from the move down? Here is the hourly chart:

(Click on the chart for a larger version)
Look at that. I now have a new tramline set the down-sloping trio. Isn't that pretty?
The C wave was met at the crossing of the upper tramlines (blue arrow), and yesterday's low was met similarly (at red arrow). Remember, when tramlines cross, that is usually enhanced support/resistance.
So now the market is trapped between two tramlines (area marked in green).
It will escape at some point but which way will the break-out be? Stay tuned!
If you're a new reader, or need a reminder about some of the methods I refer to in my trades, then do have a look at my introductory videos:
The essentials of tramline trading
An introduction to Elliott wave theory
Advanced trading with Elliott waves
Don't miss my next trading insight. To receive all my spread betting blog posts by email, as soon as I've written them, just sign up here .
Get the latest financial news, insights and expert analysis from our award-winning MoneyWeek team, to help you understand what really matters when it comes to your finances.
John is is a British-born lapsed PhD physicist, who previously worked for Nasa on the Mars exploration team. He is a former commodity trading advisor with the US Commodities Futures Trading Commission, and worked in a boutique futures house in California in the 1980s.
He was a partner in one of the first futures newsletter advisory services, based in Washington DC, specialising in pork bellies and currencies. John is primarily a chart-reading trader, having cut his trading teeth in the days before PCs.
As well as his work in the financial world, he has launched, run and sold several 'real' businesses producing 'real' products.
-
 Average UK house price reaches £300,000 for first time, Halifax says
While the average house price has topped £300k, regional disparities still remain, Halifax finds.
-
 Barings Emerging Europe trust bounces back from Russia woes
Barings Emerging Europe trust has added the Middle East and Africa to its mandate, delivering a strong recovery, says Max King