When is a Dow bear not a bear? When he’s a bull
There are few better signs of which way the market is turning than investor sentiment, says John C Burford - especially when it's all one way. So what does it tell us about the Dow?
Get the latest financial news, insights and expert analysis from our award-winning MoneyWeek team, to help you understand what really matters when it comes to your finances.
You are now subscribed
Your newsletter sign-up was successful
Want to add more newsletters?

Twice daily
MoneyWeek
Get the latest financial news, insights and expert analysis from our award-winning MoneyWeek team, to help you understand what really matters when it comes to your finances.

Four times a week
Look After My Bills
Sign up to our free money-saving newsletter, filled with the latest news and expert advice to help you find the best tips and deals for managing your bills. Start saving today!
If you've been reading MoneyWeek Trader a while, you'll know I use tramlines, Fibonacci and Elliott wave theory to find high probability trades. To see why these are such powerful trading tools, I recommend you watch my short video tutorials.
But there's something else I've found vitally important for my trading: tracking investor/trader sentiment.
After all, people generally sell when they are pessimistic, and buy when they are optimistic. This is one of the few rules of investing/trading that is golden. Market bottoms are made on high pessimism and tops on high optimism.
MoneyWeek
Subscribe to MoneyWeek today and get your first six magazine issues absolutely FREE

Sign up to Money Morning
Don't miss the latest investment and personal finances news, market analysis, plus money-saving tips with our free twice-daily newsletter
Don't miss the latest investment and personal finances news, market analysis, plus money-saving tips with our free twice-daily newsletter
Now to be honest, most of the time nothing much is going on in the various sentiment measures I follow. But I track them all the same.
And when I see either week after week of bullish or bearish extremes, or violent swings from bullish to bearish or vice versa my radar needle goes wildly off the scale. That tells me something's up and there could be an opportunity!
I'll show you what I mean in today's issue.
The latest data shows a massive swing in sentiment
Recently, I had noted the extreme bullishness towards shares that has propelled the Dow higher and higher since October.
That crucial piece of information along with the other signals I received helped me to identify the recent top at 13,312 last month. I wrote about that at the time in these posts.
Now that high was made on 27 March only three weeks ago. But the latest AAII (American Association of Individual Investors) report totally got my radar needle spinning.
Make sure you're sitting down when you read this
This week's AAII Sentiment Survey results:
Bullish: 28.1%, down 10.0 percentage points
Neutral: 30.3%, down 3.7 percentage points
Bearish: 41.6%, up 13.8 percentage points
Historical averages:
Bullish: 39%
Neutral: 31%
Bearish: 30%
I hope you can see how important this is
That is a swing of 24% from bullish to bearish in just one week! To me, that's simply staggering. It may be the wildest, most volatile swing in history.
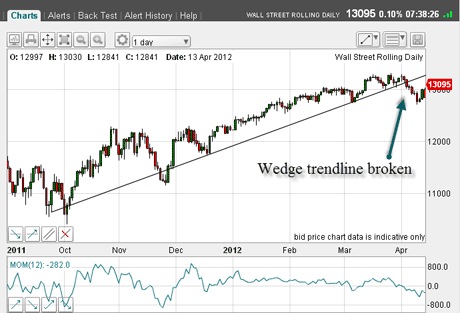
Naturally, this dramatic swing to bearishness has produced a major down-swing off the March highs. You can see that on this chart:

(Click on the chart for a larger version)
What I'm showing here is the wedge trendline that I have long been tracking in these emails. And you can see that it has finally given way.
Also see how, after the trendline break, the Dow rallies towards the underside of this line.
Large speculators' positions confirm the bearish shift
But let's get back to this all important sentiment data. I expect such a huge swing to be mirrored in the COT (Commitments of Traders) data by a net swing to the short side.
And here is the latest COT data:
Dow Jones Industrial Avg - x $5 - Chicago Board of Trade
Futures only positions as of 10/04/12
TABLE.ben-table TABLE {BORDER-BOTTOM: #2b1083 1px solid; BORDER-LEFT: #2b1083 1px solid; BORDER-TOP: #2b1083 1px solid; BORDER-RIGHT: #2b1083 1px solid}TH {TEXT-ALIGN: center; BORDER-LEFT: #a6a6c9 1px solid; PADDING-BOTTOM: 2px; PADDING-LEFT: 1px; PADDING-RIGHT: 1px; BACKGROUND: #2b1083; COLOR: white; FONT-SIZE: 0.8em; FONT-WEIGHT: bold; PADDING-TOP: 2px}TH.first {TEXT-ALIGN: left; BORDER-LEFT: 0px; PADDING-BOTTOM: 2px; PADDING-LEFT: 1px; PADDING-RIGHT: 1px; FONT-SIZE: 0.8em; PADDING-TOP: 2px}TR {BACKGROUND: #fff}TR.alt {BACKGROUND: #f6f5f9}TD {TEXT-ALIGN: center; BORDER-LEFT: #a6a6c9 1px solid; PADDING-BOTTOM: 2px; PADDING-LEFT: 1px; PADDING-RIGHT: 1px; COLOR: #000; FONT-SIZE: 0.8em; PADDING-TOP: 2px}TD.alt {BACKGROUND-COLOR: #f6f5f9}TD.bold {FONT-WEIGHT: bold}TD.first {TEXT-ALIGN: left}TD.left {TEXT-ALIGN: left}TD.bleft {TEXT-ALIGN: left; FONT-WEIGHT: bold}
| Long | Short | Spreads | Long | Short | Long | Short | Long | Short |
| ($5 DJIA index) commitments | Open interest: 99,733 | |||||||
| 36,283 | 16,885 | 54 | 47,422 | 73,534 | 83,759 | 90,473 | 15,974 | 9,260 |
| Changes from03/04/12 (Change in open interest: -5,197) | ||||||||
| -3,339 | 2,499 | -262 | -2,565 | -6,218 | -6,166 | -3,981 | 969 | -1,216 |
Sure enough, the hedge funds (non-commercials) have changed positions by a net 5,838 contracts short. I get that figure by adding the reduction in longs (3,339) and the increase in shorts (2,499). Meanwhile, the trade (commercials) have decreased their short positions by a net 3,653 contracts (6,218 - 2,565).
Overall, there's been a big shift to bearishness in the latest data. And that's shown up in the market
The Dow has lost 600 points in this period on the back of the selling from the new bear converts and some profit-taking from the bulls.
But now, with the bears firmly out-numbering the bulls (in the AAII survey, at least), what is the scope for further declines near-term?
Never be afraid to change your position when faced with facts
As a trader, that question is uppermost in my mind. I have been bearish the Dow for some time, as you know. But I am always prepared to take a look at the other side when I see an opening.
If I see more scope for a rally than a decline, I will look to take profits on any short trades and even look for a long trade.
Trader tip: Don't fall into the trap of letting your fundamental market views over-ride a high-probability opposite trade. If you are bullish on gold, for instance, make sure the market is agreeing with you and is generally rising.
The charts must line up with your views do not fool yourself into believing a bearish chart is really bullish or vice versa. If you stick rigidly to your bullish view till death and your funds do you part, you will be fighting the market- perhaps for a long time. And guess who will be the winner in that one!
The best policy here is to stand aside and preserve capital and seek other markets that are agreeing with you or to take the other side!
OK, with such high current bearishness, we have a possible set-up for big rallies. Why? Simply because on the way down during the 600-point drop, the new bears (shorts) will need to buy back their positions if the market can stage a rally to where their buy-stops are placed.
This is a recipe for a classic short squeeze.
Don't you know the professional traders know this? They will be probing the long side (buying), as they try to light the blue touch-paper anticipating the rocket of buy-stops to take off. That's how they make their money by exploiting the weak links in the chain. And that usually means the Johnny-come-lately speculators with fresh short positions.
Trader tip: This has been going on for many years by the "big boys". If you haven't read it, I very much recommend "Reminiscences of a Stock Operator" by Edwin Lefvre. This lively read describes how Jesse Livermore operated in the 1920s by reading the ticker tape as it spewed out of the clacking machines. Today, operators have much more sophisticated and quieter tools, but the principle is still the same. Livermore was definitely not your buy-and-hold man!
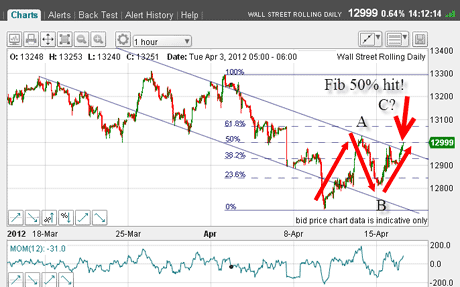
Note: I wrote the whole of the above section yesterday afternoon before the stunning near-200 point rally later in the US session. Here is the chart I took at that time I was writing:

(Click on the chart for a larger version)
The market was pushing up against my upper tramline and had the potential to form an A-B-C pattern. Also, the market had hit again the Fibonacci 50% retrace.
Now that's pretty strong resistance. But based on the analysis I gave above, I felt that the blue touch paper had been lit. To me, it was a question of time before the rocket took off.
I felt then that a convincing move above 13,000 could well see my target at the 13,100 level the Fib 62% retrace hit. And it duly was hit in late afternoon. That move squeezed a lot of shorts!
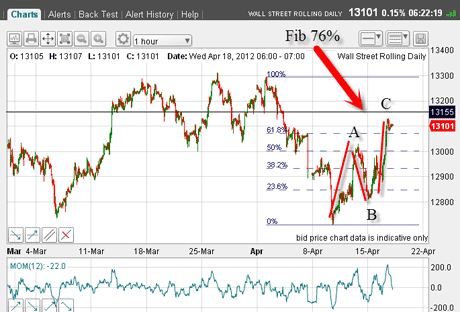
So how do things look now? Well, writing this morning here's what the latest charts show:

(Clickon the chart for a larger version)
We have a nicely-proportioned A-B-C (counter-trend) and the market is approaching the Fibonacci 76% retrace at the 13,150 area.
The market could extend to this level. But it's heading into considerable overhead resistance, so I'm not so sure it will make it.
Now with markets so polarised, I expect more volatility as the bulls and bears slug it out. One thing's for sure the fight will be exciting! Keep reading MoneyWeek Trader I'll be covering the rounds for you in these emails.
And if you can master the techniques I'm showing you here, then you'll be on your way to finding some great trades of your own. I hope you're finding these emails useful.
If you're a new reader, or need a reminder about some of the methods I refer to in my trades, then do have a look at my introductory videos:
The essentials of tramline trading
An introduction to Elliott wave theory
Advanced trading with Elliott waves
Don't miss my next trading insight. To receive all my spread betting blog posts by email, as soon as I've written them, just sign up here .
Get the latest financial news, insights and expert analysis from our award-winning MoneyWeek team, to help you understand what really matters when it comes to your finances.
John is is a British-born lapsed PhD physicist, who previously worked for Nasa on the Mars exploration team. He is a former commodity trading advisor with the US Commodities Futures Trading Commission, and worked in a boutique futures house in California in the 1980s.
He was a partner in one of the first futures newsletter advisory services, based in Washington DC, specialising in pork bellies and currencies. John is primarily a chart-reading trader, having cut his trading teeth in the days before PCs.
As well as his work in the financial world, he has launched, run and sold several 'real' businesses producing 'real' products.
-
 MoneyWeek Talks: The funds to choose in 2026
Podcast Fidelity's Tom Stevenson reveals his top three funds for 2026 for your ISA or self-invested personal pension
-
 Three companies with deep economic moats to buy now
Opinion An economic moat can underpin a company's future returns. Here, Imran Sattar, portfolio manager at Edinburgh Investment Trust, selects three stocks to buy now