Why the bear market rally in stocks could end soon
Markets have seen some surprisingly large bounces since 2007. But John C Burford believes these could soon end, and is on the lookout for short trades.
Get the latest financial news, insights and expert analysis from our award-winning MoneyWeek team, to help you understand what really matters when it comes to your finances.
You are now subscribed
Your newsletter sign-up was successful
Want to add more newsletters?

Twice daily
MoneyWeek
Get the latest financial news, insights and expert analysis from our award-winning MoneyWeek team, to help you understand what really matters when it comes to your finances.

Four times a week
Look After My Bills
Sign up to our free money-saving newsletter, filled with the latest news and expert advice to help you find the best tips and deals for managing your bills. Start saving today!
As I've noted before, the Dow has been displaying surprisingly large corrective bounces to sharp bear market declines since 2007, when it made its all-time high.
And here we are witnessing yet another one as I write!
But the great thing about tramlines is that they can keep me on track and give me clues as to possible trend changes. And, so far, the major tramline pair I have been working with is holding. I'll get to that in a moment.
MoneyWeek
Subscribe to MoneyWeek today and get your first six magazine issues absolutely FREE

Sign up to Money Morning
Don't miss the latest investment and personal finances news, market analysis, plus money-saving tips with our free twice-daily newsletter
Don't miss the latest investment and personal finances news, market analysis, plus money-saving tips with our free twice-daily newsletter
First, though, I want to try to give you a rationale behind the latest corrective bounce of around 500 points on the Dow a very substantial correction indeed!
Here's what's causing the market to rally
As you know, I like to keep a weather eye on sentiment in the market. There are multiple ways to monitor sentiment. I often use Commitments of Traders (COT) data as well as investor and professional surveys, such as the AAII survey of mom and pop' retail investors, and trade-futures.com for professional advisors.
But one important measure I have not mentioned before is the short interest on the various markets. Once again, the US exchanges lead the way in gathering and making available this data and recently, short interest has exploded on many exchanges.
For example, here is just one snapshot of the short interest on some shares on the NYSE.
Isn't that incredible? Some companies have over 40% of their issued shares having been sold short! Of course, there are few, if any, major large cap shares with this high short interest.
But with sentiment having turned negative, the market has been doing what markets do they give late-comers a slap in the face.
That is some recipe for a massive short squeeze.
And that is why I do get nervous when too many bearish articles appear in the press they attract the less informed which provides the fuel for sharp rallies as they scramble to cover their shorts.
And that is what I believe has been a major driving force to produce this 500-pip rally.
But you're interested in where the market's heading next. So let's take a look at where are we now on the chart.
Why I abandoned my latest short trade
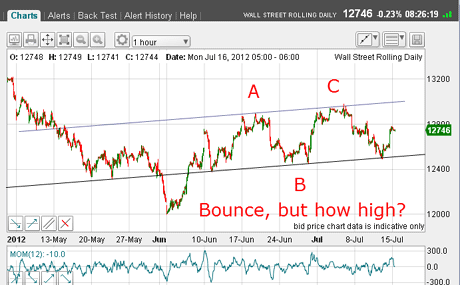
When I wrote about the Dow on Monday, this was the state of play:

(Click on the chart for a larger version)
The market was in the process of bouncing off my lower tramline and the big question was: how high?
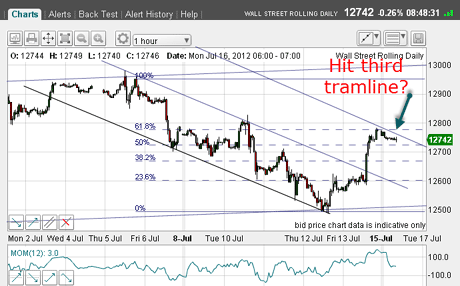
I had identified an entry for a short sale that morning:

(Click on the chart for a larger version)
My tramline had been hit and momentum was overbought as it hit the Fibonacci 62% level.
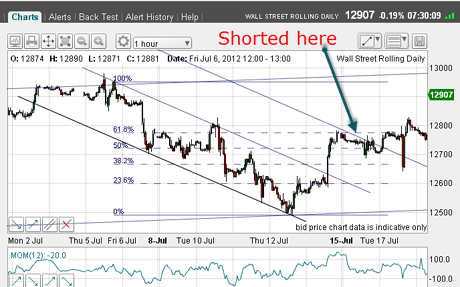
Let's see how this trade panned out:

(Click on the chart for a larger version)
The market did come off after my short sale, but proceeded to wobble around my tramline.
When the market made a sharp plunge on Tuesday, I thought we were off to the races down towards the centre tramline (my target).
But the market had other ideas! It recovered to take it above the tramline again.
At that point, I knew something else was going on and abandoned the trade.
Trader tip: If the market does not follow your plan, it is often best to abandon the trade and wait for the patterns to gel.
Because it looked like the rally was not over, I decided to bide my time. Going long here didn't interest me, as there was significant resistance up ahead. And anyway, the best time to take a counter-trend trade is right near the start. Remember, the bear trend could resume at any time.
Solid earnings drive the market to my upper tramline
In the end, market bullishness was ramped up yesterday. That came on the back of decent second quarter earnings from some majors with Microsoft being a notable exception.
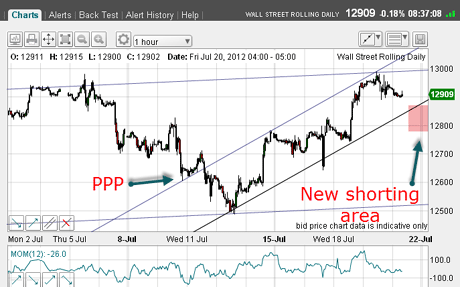
So the rally carried on to the 13,000 area and met my upper tramline:

(Click on the chart for a larger version)
And that's not all! I can now draw a new up-sloping tramline pair.
The upper tramline is classic, with a good prior pivot point (PPP) and two superb touch-points the second is where this line crosses my major tramline.
That looks like a textbook area for me to take a new short trade so I'm on the lookout.
Also, the form of the rally is a new A-B-C, thus satisfying my requirement for this being a counter-trend rally, not a new bull phase.
Was 13,000 the top?
This morning then, the odds are good that yesterday's 13,000 top is the high of the move.
Confirmation would come if and when the lower tramline is penetrated (pink bar on the chart above). That's an area where I may well be placing sell stops to enter.
But if the market rallies above 13,000, a visit back to the drawing board would beckon. It would not necessarily destroy my bearish stance, though, since a brief over-shoot of my major tramline would be allowed.
Incidentally, many investors make investment decisions based on company earnings, and we are in a US earnings season. Keep in mind that earnings reports are lagging data points, and usually give no clue as to future stock price direction.
I have noted that very often, when a company announces high and better than expected earnings savvy traders sell into the rally. That's because they fear this super performance cannot be matched in the next period and they want to lock in their gains. So in many cases, shares take a tumble just after good reports.
In any case, stocks are generally firm prior to a good earnings report, because the bullish sentiment that produced the good earnings also gave rise to the share appreciation. That's how markets work and that is what we are seeing this month with an easing of bearish sentiment.
It is the invisible hand that directs the markets. It is not government action, Fed policy, or even Warren Buffett! All of the above have an influence, but when public sentiment turns sour, expect falling markets and vice versa, of course.
Has the Dow counter-trend rally got more legs? Or are we about to see the big sell-off I've been looking for these last few months? We'll have to wait and see!
If you have a view or any thoughts on today's issue, please share them below.
If you're a new reader, or need a reminder about some of the methods I refer to in my trades, then do have a look at my introductory videos:
The essentials of tramline trading
An introduction to Elliott wave theory
Advanced trading with Elliott waves
Don't miss my next trading insight. To receive all my spread betting blog posts by email, as soon as I've written them, just sign up here .
Get the latest financial news, insights and expert analysis from our award-winning MoneyWeek team, to help you understand what really matters when it comes to your finances.
John is is a British-born lapsed PhD physicist, who previously worked for Nasa on the Mars exploration team. He is a former commodity trading advisor with the US Commodities Futures Trading Commission, and worked in a boutique futures house in California in the 1980s.
He was a partner in one of the first futures newsletter advisory services, based in Washington DC, specialising in pork bellies and currencies. John is primarily a chart-reading trader, having cut his trading teeth in the days before PCs.
As well as his work in the financial world, he has launched, run and sold several 'real' businesses producing 'real' products.
-
 MoneyWeek Talks: The funds to choose in 2026
Podcast Fidelity's Tom Stevenson reveals his top three funds for 2026 for your ISA or self-invested personal pension
-
 Three companies with deep economic moats to buy now
Opinion An economic moat can underpin a company's future returns. Here, Imran Sattar, portfolio manager at Edinburgh Investment Trust, selects three stocks to buy now