Dow delays its big move down
The Dow Jones bounced higher than expected on Friday. So has John C Burford changed his stance, or is he still looking to short the Dow?
Get the latest financial news, insights and expert analysis from our award-winning MoneyWeek team, to help you understand what really matters when it comes to your finances.
You are now subscribed
Your newsletter sign-up was successful
Want to add more newsletters?

Twice daily
MoneyWeek
Get the latest financial news, insights and expert analysis from our award-winning MoneyWeek team, to help you understand what really matters when it comes to your finances.

Four times a week
Look After My Bills
Sign up to our free money-saving newsletter, filled with the latest news and expert advice to help you find the best tips and deals for managing your bills. Start saving today!
If you've been reading MoneyWeek Trader for a while, you'll know I've been bearish on stocks.
And given that markets have generally worked higher over the past couple of months, several readers have been questioning my stance. I also note from comments on my articles that some traders have a different interpretation of the Elliott waves than mine.
That's absolutely fine by me and indeed it's to be encouraged. After all, it's one reason why we have markets at all to enable people with opposing views to express them by putting their money where their mouths are. For every buyer, there is a seller.
MoneyWeek
Subscribe to MoneyWeek today and get your first six magazine issues absolutely FREE

Sign up to Money Morning
Don't miss the latest investment and personal finances news, market analysis, plus money-saving tips with our free twice-daily newsletter
Don't miss the latest investment and personal finances news, market analysis, plus money-saving tips with our free twice-daily newsletter
This brings up the crucial question of time-frame
Why it's fine to be bullish and bearish at the same time
I can be bullish on the hourly chart, yet bearish on the daily. If we define a trend where a bull market shows rising lows and rising highs with a bear trend showing the opposite we can often identify definitively which trend we are dealing with.
And we can have a bull trend in one time-frame, and a bear trend in another. That's not unusual at all.
The other important point is that everyone working with Elliott waves must obey the rules of this discipline and they are several and (at times) complex.
It was a huge achievement for Ralph Elliott working as he did in the 1930s and 1940s without the benefit of the huge computing power and data we have today to identify from his hand-drawn Dow charts most of the patterns, rules and guidelines that we still use today.
And finally, we traders are in the business of making forecasts based on what evidence we have in the moment. As time goes on, this evidence builds up and we may be forced to change our forecasts in the light of this new knowledge. Nimble traders will be able to act promptly, while those who steadfastly cling to their old' beliefs will have difficulty.
We come to trading with our different personalities and if we wish to become better traders, we need to understand our strengths and weaknesses. We must not let any weakness we may have lead us into huge losses which risk kicking us out of the game.
But the bottom line is this: we are all here to make profits. I don't care whether you make it through a method of your own, or use my methods, or by sheer luck. Just make profits!
And for those of my readers who wish to learn my methods and feel attuned to them, I will help you all I can.
The Dow bounces on Friday as expected
OK, let me follow up Friday's article on the Dow, as it is at an important juncture following the big rally later in the day.
On Friday, I showed that terrific tramline trade where I had shorted near the upper tramline and covered at the lower one for a short-term profit of around 400 pips.
Thursday's dip to the 12,500 area took it to the crossing of two tramlines, as I explained. I expected a bounce off this level and what a bounce there was!
The market was excited by the hope that more stimulus money from the USA and China is now guaranteed, following the release of a weak set of economic data.
This is in the well-worn tradition that a weak economy produces a strong stock market. It seems perverse, doesn't it? And it's one of the many reasons why trading on fundamentals' is often a lost cause.
Since the all-time Dow high of over 14,000 in 2007, I have noted that many relief rallies from sharp declines have been large in many cases, larger than the Fibonacci 76% retracement level. That is why I am always on the alert for such high bounces.
Will we see a similarly sized rally this time? Let's go to the chart:

(Click on the chart for a larger version)
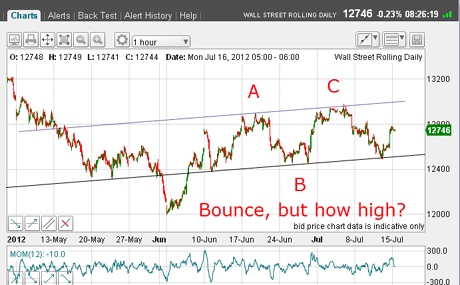
The bounce has been sharp, so the lower tramline provides huge support, and any break would be significant.
But will the market bounce up to the upper tramline again? If it does, it will rise above my C wave top, which will put my A-B-C labels in jeopardy.
Let's zoom in closer:

(Click on the chart for a larger version)
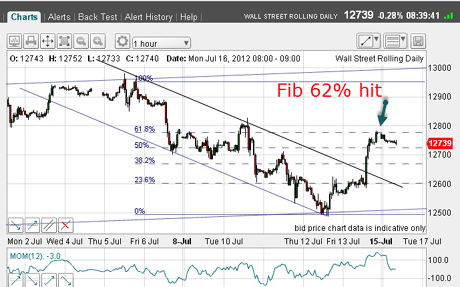
Remember on Friday, I said that if the market punched up through the upper down-sloping tramline, I would head back to the drawing board, and that is what I am doing.
So am I changing my stance now?
My Elliott wave labels are still intact
I have drawn in the Fibonacci levels for the decline off the C wave high and late on Friday, the market hit the Fibonacci 62% level and with a possible A-B-C form to the bounce.
Of course, the market may move higher in a deeper retracement of the C wave. But, this C wave high has not yet been violated, and until it does, my labels will stay.
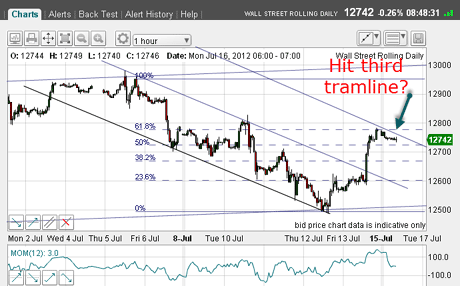
Now I have a tramline break, I can now draw a third parallel tramline above:

(Click on the chart for a larger version)
And as you can see, the market has hit it.
I now have two clues that the market may have topped a Fibonacci retrace and a tramline resistance area.
So I'm playing this as a relief bear market rally and have taken this as an opportunity to take a short trade, using a close stop.
Let's see how this plays out.
Keep the comments coming, by the way. It's interesting to know what you see on the charts and how you're getting on with tramlines, Elliott waves and Fibonacci. Share your thoughts below.
If you're a new reader, or need a reminder about some of the methods I refer to in my trades, then do have a look at my introductory videos:
The essentials of tramline trading
An introduction to Elliott wave theory
Advanced trading with Elliott waves
Don't miss my next trading insight. To receive all my spread betting blog posts by email, as soon as I've written them, just sign up here .
Get the latest financial news, insights and expert analysis from our award-winning MoneyWeek team, to help you understand what really matters when it comes to your finances.
John is is a British-born lapsed PhD physicist, who previously worked for Nasa on the Mars exploration team. He is a former commodity trading advisor with the US Commodities Futures Trading Commission, and worked in a boutique futures house in California in the 1980s.
He was a partner in one of the first futures newsletter advisory services, based in Washington DC, specialising in pork bellies and currencies. John is primarily a chart-reading trader, having cut his trading teeth in the days before PCs.
As well as his work in the financial world, he has launched, run and sold several 'real' businesses producing 'real' products.
-
 Average UK house price reaches £300,000 for first time, Halifax says
While the average house price has topped £300k, regional disparities still remain, Halifax finds.
-
 Barings Emerging Europe trust bounces back from Russia woes
Barings Emerging Europe trust has added the Middle East and Africa to its mandate, delivering a strong recovery, says Max King