The Aussie dollar has hit a new low – here’s how I’m playing it
The Australian dollar has declined into new low ground. John C Burford looks to the charts to find likely places to take profits.
Get the latest financial news, insights and expert analysis from our award-winning MoneyWeek team, to help you understand what really matters when it comes to your finances.
You are now subscribed
Your newsletter sign-up was successful
Want to add more newsletters?

Twice daily
MoneyWeek
Get the latest financial news, insights and expert analysis from our award-winning MoneyWeek team, to help you understand what really matters when it comes to your finances.

Four times a week
Look After My Bills
Sign up to our free money-saving newsletter, filled with the latest news and expert advice to help you find the best tips and deals for managing your bills. Start saving today!
The euro crisis seems to have no end, and has been getting the lion's share of coverage alongside the spectacular bursting of the China stock bubble. So as a respite, I thought I would follow up on my take on the AUS/USD cross which I last covered on 26 June.
The trading lessons currently provided by the Aussie are clear. They bring into sharp focus why my tramline method can be used very profitably by many traders who want a simple easy-to-apply system.
On 26 June, I showed that the market was very probably near the start of a wave 5 down. I based that assessment, as seen below, on the form of the wave pattern.
MoneyWeek
Subscribe to MoneyWeek today and get your first six magazine issues absolutely FREE

Sign up to Money Morning
Don't miss the latest investment and personal finances news, market analysis, plus money-saving tips with our free twice-daily newsletter
Don't miss the latest investment and personal finances news, market analysis, plus money-saving tips with our free twice-daily newsletter
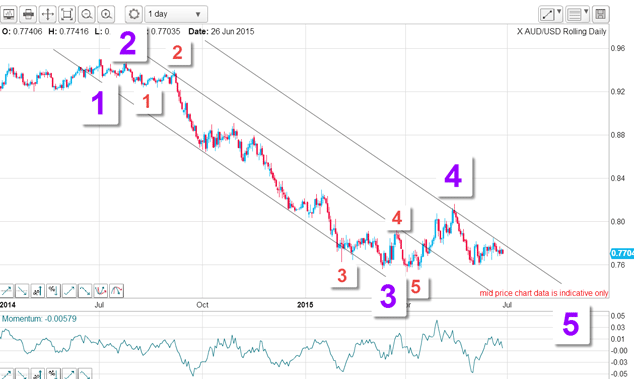
The very long and strong bear move from last summer to the January lows is clearly a third wave simply because it is long and strong. The relief rally is then a wave 4 and the current wave is wave 5. So far, so good.
Commodity prices have tumbled
In recent days, iron ore prices have slumped yet again as China's economy is teetering. Crude oil prices have also taken another tumble, and gold remains firmly on its launch pad (or even going backwards!).
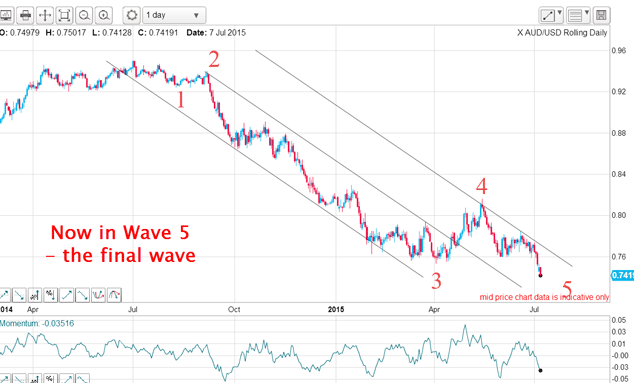
With that negative input, the Aussie has sold off in sympathy and has declined into new low ground to confirm my wave 5 count. Here is the updated daily chart:
In fact, there was a terrific trade opportunity prior to this latest plunge that was captured perfectly by my method.
Below is the hourly chart I showed last time. After the five down, there appeared a lovely textbook A-B-C and the market was heading towards my lower tramline.
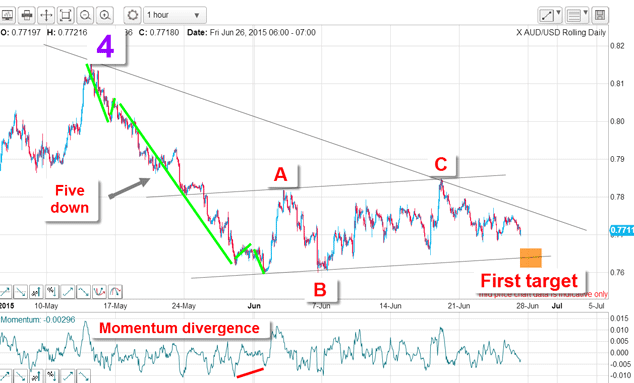
Not only was there the tramline pair as shown, but I could also draw a fine wedge. My lower green wedge line has multiple accurate touch points and was broken right after I wrote the 26 June email. That was an excellent short trade entry.
But another presented itself when the market rallied to plant a textbook kiss on the underside of that line.
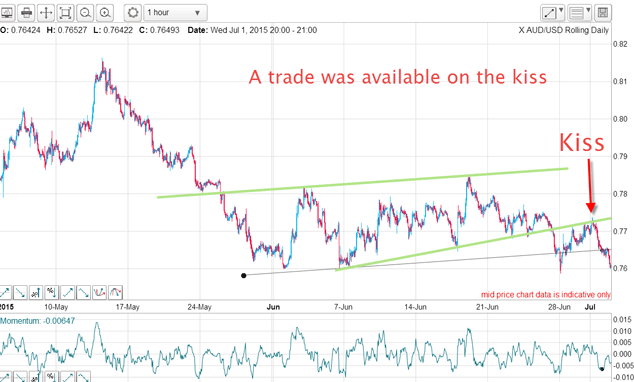
This one offered an even lower risk trade because the protective stop could be placed quite close to the line. So there were two excellent trade entry points available.
Don't panic
That is one of the major features of my tramline method. When you have drawn in reliable tramlines (and wedge lines), you can make projections of where the market is likely to reach.
Taking the kiss as an example, here is the hourly chart. The green wedge line support was broken on 26 June. When it made its low, it began a normal rally back to the line which it kissed on 1 July, allowing two to three days to plan your trade.
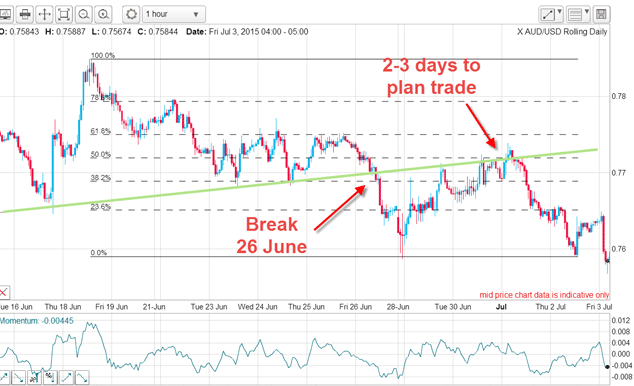
You had plenty of time to enter a limit order which was executed while you were probably asleep. That is what I call relaxed trading!
Now, we are in a fifth wave and this is the final wave of a five down. When trading fifth waves, you must keep an eye out for a major reversal which will come at some point.
Can we find any likely targets where profit-taking could take place?
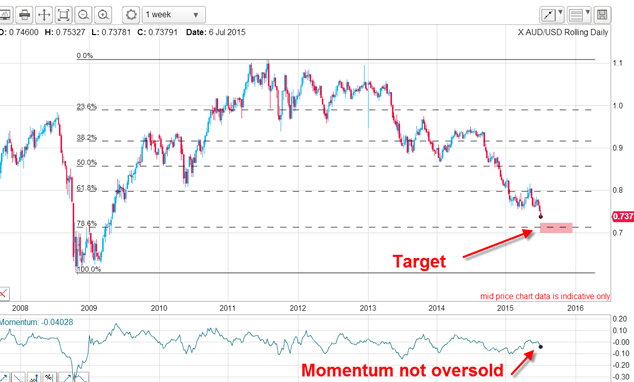
Here is one clue provided by the weekly chart below. Currently, the market is heading for the Fibonacci 78% retrace of the entire rally from the 2008 low to the 2011 high. That would be one possibility.
But currency market trends have a habit of acting like the Duracell bunny they just keep on going.
Because stock markets are on the slide, I plan to cover some major stock charts on Friday. Make sure you tune in then!
Get the latest financial news, insights and expert analysis from our award-winning MoneyWeek team, to help you understand what really matters when it comes to your finances.
John is is a British-born lapsed PhD physicist, who previously worked for Nasa on the Mars exploration team. He is a former commodity trading advisor with the US Commodities Futures Trading Commission, and worked in a boutique futures house in California in the 1980s.
He was a partner in one of the first futures newsletter advisory services, based in Washington DC, specialising in pork bellies and currencies. John is primarily a chart-reading trader, having cut his trading teeth in the days before PCs.
As well as his work in the financial world, he has launched, run and sold several 'real' businesses producing 'real' products.
-
 Pension Credit: should the mixed-age couples rule be scrapped?
The mixed-age couples rule was introduced in May 2019 to reserve pension credit for older households but a charity warns it is unfair
-
 Average income tax by area: The parts of the UK paying the most tax mapped
The UK’s total income tax bill was £240.7 billion 2022/23, but the tax burden is not spread equally around the country. We look at the towns and boroughs that have the highest average income tax bill.