A Lesson in Tramline Trading in the Dow
John C Burford illustrates how to use tramlines to identify trading tops and bottoms as the Dow Jones continues its bumpy ride.
Get the latest financial news, insights and expert analysis from our award-winning MoneyWeek team, to help you understand what really matters when it comes to your finances.
You are now subscribed
Your newsletter sign-up was successful
Want to add more newsletters?

Twice daily
MoneyWeek
Get the latest financial news, insights and expert analysis from our award-winning MoneyWeek team, to help you understand what really matters when it comes to your finances.

Four times a week
Look After My Bills
Sign up to our free money-saving newsletter, filled with the latest news and expert advice to help you find the best tips and deals for managing your bills. Start saving today!
I am now back after my short break and I see there has been some action in the markets!
I will focus on the Dow today, and will cover gold tomorrow, where there has been a significant development.
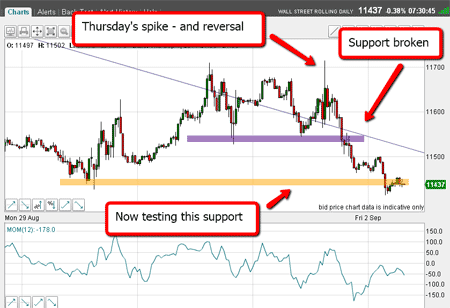
When I left the Dow on Friday, the market was coming off the wave C high, and I had established new short trades in the areas of my coloured bars in the range around 11,500 (see the second chart in Friday's article, which I've repeated below).
MoneyWeek
Subscribe to MoneyWeek today and get your first six magazine issues absolutely FREE

Sign up to Money Morning
Don't miss the latest investment and personal finances news, market analysis, plus money-saving tips with our free twice-daily newsletter
Don't miss the latest investment and personal finances news, market analysis, plus money-saving tips with our free twice-daily newsletter
(Click on the chart for a larger version)
After I wrote that, the market continued lower, which enabled traders to move their protective stops to break even, following my break even rule.
Looking for a bounce to trade
The question that I did not answer on Friday was: what is my main target an area where I can expect a bounce, and where short-term traders can take profits?
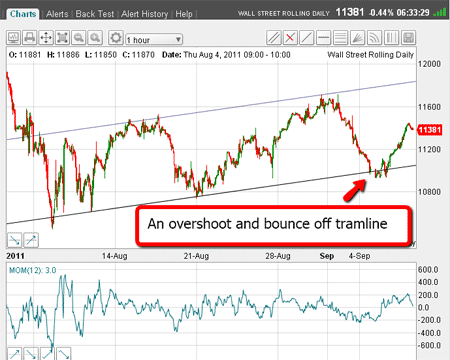
As ever, I like to rely on my tramlines to help find my target. Here is the hourly chart as of this morning:
(Click on the chart for a larger version)
I can draw my lower tramline across several significant lows up to the 21 August low. Then my upper tramline (which is parallel, if you'll remember) practically draws itself! It passes right across the two major highs of waves A and C.
Note that I am now able to slightly alter the positions from my first guess.
So that was clearly my main target my lower tramline in the sub-11,000 area.
And that is precisely where the market reached on Tuesday.
This is exactly where short-term traders were taking profits for terrific gains of around 600 pips, or £600 per £1 spread bet. Very nice work.
After the bounce, how high will it go?
OK, we are getting that bounce I predicted. The next question is of course: how high will the bounce reach before resuming the main downtrend?
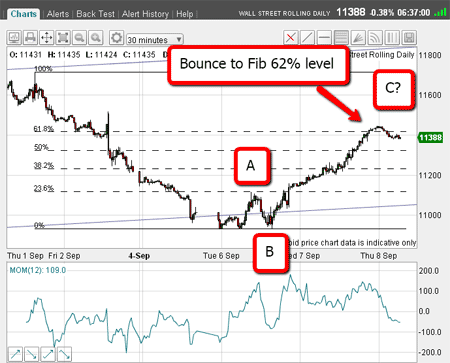
Here is the 30-minute chart as of this morning:
(Click on the chart for a larger version)
From Tuesday's low, I was expecting a decent bounce, since I felt the market was getting very short.
By that, I mean the chorus of bearish noises was getting very loud. Gloom and doom was thick on the ground this week.
Trading tip: To get a quick measure of market sentiment, read the headlines of financial articles (don't bother with the article itself!). When most are bearish - and they will be after a good decline - expect a rally.
And so we are finding the rally so far is a good 500 pips off Tuesday's low. I can confidently say that much of this is due to short-covering by the Johnny-come-latelies who read headlines and then act.
Trading tip: Get ahead of the headlines! Get ahead of the herd. Don't react to the news. With a bit of experience, you can actually predict the headlines with good accuracy.
As you can see, the rally has carried to the Fibonacci 62% retrace of the move down from the most recent wave C high.
That is where I will put out short trades using my 3% rule for protection.
A mini-head and shoulders is forming
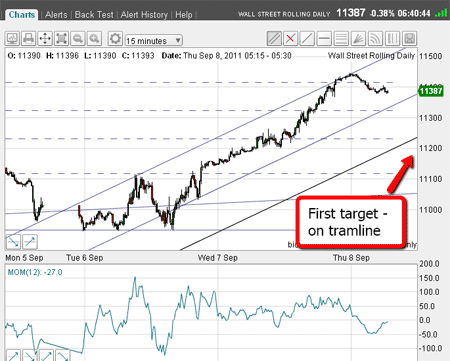
Now, let's have a look at the structure of this rally. Here is the 15-minute chart as of this morning:
(Click on the chart for a larger version)
I have three tentative tramlines, which I admit are not perfect, but are good enough for a first attempt.
My first target will be the lower tramline. If this level is reached, that will give me more confidence that I have nailed the top at the Fibonacci 62% level.
For a bit of fun, I will do something I have never done before in these emails show a close-up in a five-minute chart:
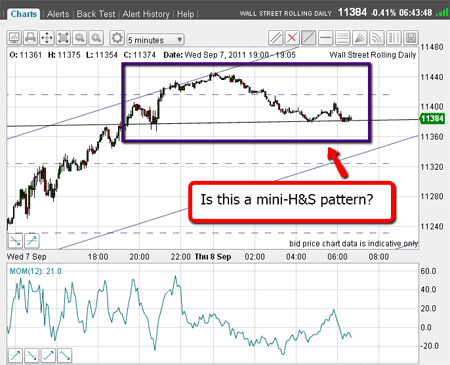
(Click on the chart for a larger version)
You can see that the market is toying with the Fibonacci 62% level, but I can also spot a mini 'head and shoulders'.
I have drawn the neckline, and the market is currently trading right on it.
By the time you read this, the market will have moved away from the neckline. If I get a move down, then my first target will come into sharp focus.
Also remember, long-term traders will still be short from the 12,800 area and holding (or even adding on these rallies in a pyramid fashion (I may cover this interesting topic in another email later).
I expect some more fireworks today, as the market is waiting for the US president to say how he will save the US economy. Hmmm.
Don't forget, I will cover gold tomorrow, and hope to get to currencies early next week.
Don't miss my next trading insight. To receive all my spread betting blog posts by email, as soon as I've written them, just sign up here .
Get the latest financial news, insights and expert analysis from our award-winning MoneyWeek team, to help you understand what really matters when it comes to your finances.
John is is a British-born lapsed PhD physicist, who previously worked for Nasa on the Mars exploration team. He is a former commodity trading advisor with the US Commodities Futures Trading Commission, and worked in a boutique futures house in California in the 1980s.
He was a partner in one of the first futures newsletter advisory services, based in Washington DC, specialising in pork bellies and currencies. John is primarily a chart-reading trader, having cut his trading teeth in the days before PCs.
As well as his work in the financial world, he has launched, run and sold several 'real' businesses producing 'real' products.
-
 Inheritance tax investigations net HMRC an extra £246m from bereaved families
HMRC embarked on almost 4,000 probes into unpaid inheritance tax in the year to last April, new figures show, in an increasingly tough crackdown on families it thinks have tried to evade their full bill
-
 Average UK house price reaches £300,000 for first time, Halifax says
While the average house price has topped £300k, regional disparities still remain, Halifax finds.