Today, I want to focus on the Nikkei chart, because it demonstrates a vital lesson in chart reading a skill I would like you all to master. That is because it can open up amazingly good and quick low-risk profit opportunities that you may have missed.
Last Friday, I showed this daily chart on the Nikkei:
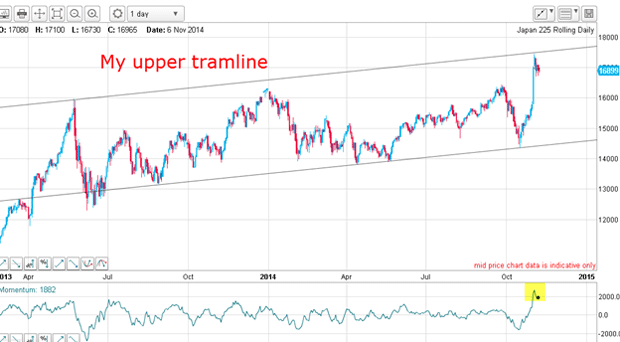
I have an excellent lower tramline and my upper tramline was recently hit by the Abe rocket and stopped dead in its tracks (do rockets have tracks?).
Try 6 free issues of MoneyWeek today
Get unparalleled financial insight, analysis and expert opinion you can profit from.

Sign up to Money Morning
Don't miss the latest investment and personal finances news, market analysis, plus money-saving tips with our free twice-daily newsletter
Don't miss the latest investment and personal finances news, market analysis, plus money-saving tips with our free twice-daily newsletter
With momentum showing a very over-bought market, a pause in the rocket's ascent seemed highly likely.

How to trade Friday's wedge
This was the hourly chart on Friday:
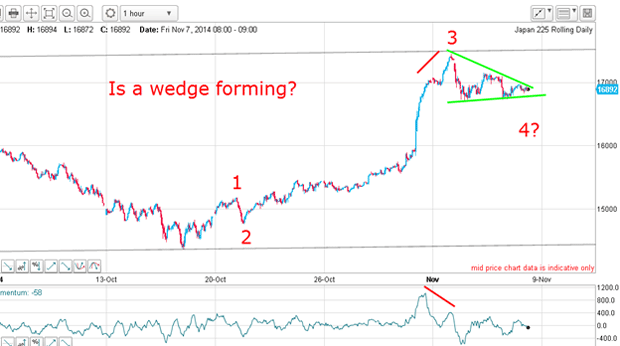
This is what I wrote: "Note the large negative-momentum divergence at the wave 3 high. This is often a signal that the wave is terminating and to get ready for a pull-back. And the nature of the pull-back should give a clue as to the near-term direction.
"In fact, wave 4 is shaping up to be a wedge, which is a typical complex fourth wave pattern. So far, so good. The move out of the wedge should be sharp."
As I expected, the wedge did complete. So, was the break out of it sharp and upward?
You be the judge.
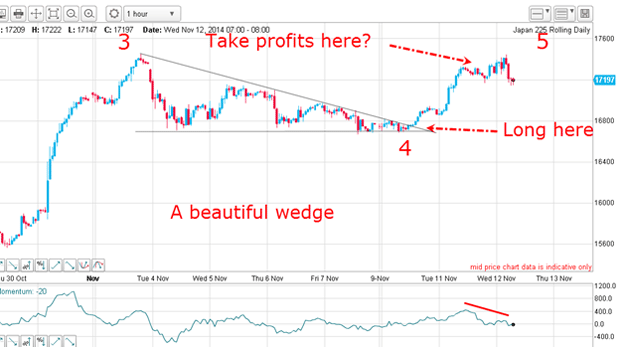
The correct trade was to set an entry buy-stop just above the wedge line, of course. A close protective stop could have been employed.
Another benefit of Elliot wave theory
Why did I expect a move up and not a move down? Because of the Elliott waves (EW) picture the five-wave pattern was not complete.
This is one more added benefit of keeping track of where the market is in reference to your EW labels.
Here I have a long and strong wave 3 as required, and all I needed was for the wave 4 down to terminate and set the stage for a final rally in wave 5, which is in progress as I write.
The wave 4 termination was signaled by the move above the upper wedge line. It really is that simple.
The market rallied to the Fibonacci 78% level yesterday, which was a great place to take a one-day profit of around 600 points, even though wave 5 had likely not finished (it had not poked above the wave 3 high yet).
Remember, a fifth wave is the final wave of the pattern before a reversal, which means that I do not want to be hanging around in a fifth wave too long.
And there is another reason for caution my longer-term tramlines. Here is the daily:
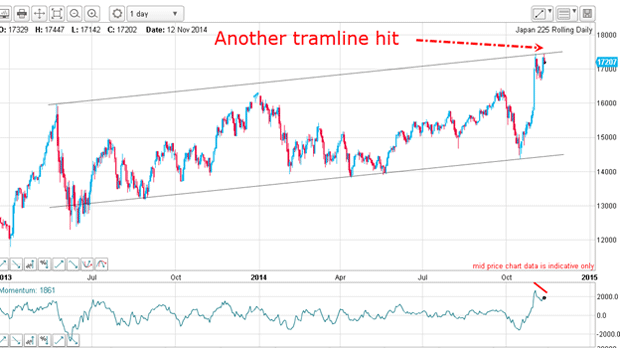
The latest rally has hit my upper tramline again, and on a negative-momentum divergence.
And because the third wave is exceptionally long and strong, there is an enhanced risk the fifth wave could be shorter than normal. Under these conditions, a rare truncated fifth wave is possible.
This is a very confusing sentiment picture
In terms of sentiment, I noted last time that there was a mass of short covering which produced the third wave. But does the COT (commitments of traders) data back this up?
Here are the latest figures from 4 November:
| (Nikkei index x JPY 500) | Row 0 - Cell 1 | Row 0 - Cell 2 | Row 0 - Cell 3 | Open interest: 118,205 | ||||
| Commitments | ||||||||
| 47,306 | 15,809 | 2,868 | 57,008 | 32,436 | 107,182 | 51,113 | 11,023 | 67,092 |
| Changes from 10/28/14 (Change in open interest: 29,497) | ||||||||
| 12,826 | 6,151 | 1,594 | 14,208 | 11,284 | 28,628 | 19,029 | 869 | 10,468 |
| Percent of open in terest for each category of traders | ||||||||
| 40.0 | 13.4 | 2.4 | 48.2 | 27.4 | 90.7 | 43.2 | 9.3 | 56.8 |
| Number of traders in each category (Total traders: 93) | ||||||||
| 42 | 7 | 8 | 31 | 21 | 73 | 36 | Row 8 - Cell 7 | Row 8 - Cell 8 |
Incredibly, the hedge funds increased their longs and shorts but now stand three-to-one long, while the small trader is taking the opposite stance, being six-to-one short. That is one confusing picture! And it tells me very little, I confess.
I mentioned that short covering was a large component of the sharp wave 3 rally. The COT data, which does not reflect this very much, captures only the Nikkei futures traders.
There are other ways to position short Japanese shares, such as the usual method of borrowing a company's shares and selling in the stock market. These trades are not captured by the futures market data.
So now, with my upper tramline in the process of being challenged, I will await developments, having taken a nice profit.
Incidentally, I hope you spotted the small five-wave pattern in wave 5 and the negative-momentum divergence at the top (as marked) on the hourly chart.