Are Japanese shares really off to the moon?
Japan's benchmark Nikkei 225 index soared after the Bank of Japan announcement. But can it keep going? John C Burford checks the charts.
Get the latest financial news, insights and expert analysis from our award-winning MoneyWeek team, to help you understand what really matters when it comes to your finances.
You are now subscribed
Your newsletter sign-up was successful
Want to add more newsletters?

Twice daily
MoneyWeek
Get the latest financial news, insights and expert analysis from our award-winning MoneyWeek team, to help you understand what really matters when it comes to your finances.

Four times a week
Look After My Bills
Sign up to our free money-saving newsletter, filled with the latest news and expert advice to help you find the best tips and deals for managing your bills. Start saving today!
A week ago on Halloween, the Bank of Japan (BOJ) suddenly announced a massive programme of equity and bond QE-style purchases on the open market. The size of the programme was larger per unit of GDP than even the US Fed's controversial QE (quantitative easing) operations.
When that news hit the wires, pandemonium ensued and the Nikkei index shot up by around 5% within hours. It was pretty obvious that the BOJ would do whatever it took to levitate shares in much the same way as other central banks have accomplished.
But when a story is widely-believed, that is when I start to look behind the curtain, as did the little dog Toto in The Wizard of Oz, who revealed the wizard as a flesh and blood illusionist with no real power, except that of a PR man.
MoneyWeek
Subscribe to MoneyWeek today and get your first six magazine issues absolutely FREE

Sign up to Money Morning
Don't miss the latest investment and personal finances news, market analysis, plus money-saving tips with our free twice-daily newsletter
Don't miss the latest investment and personal finances news, market analysis, plus money-saving tips with our free twice-daily newsletter
In the week since then, the market has been digesting the BOJ action, and the chart tells an interesting story. So today, I want to show you how this example demonstrates the power of tramlines in setting targets.
The basis of my tramline method
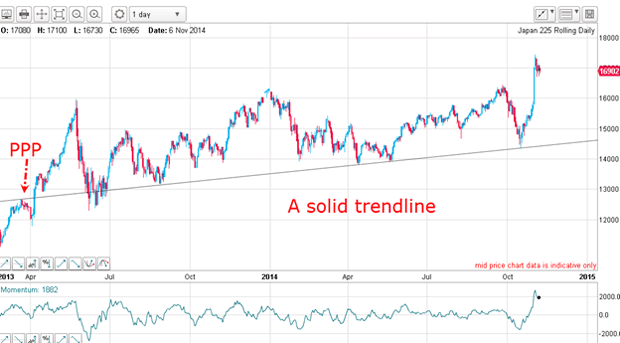
Here is the daily:

For around 18months, the market has been in a gently-sloping uptrend with wide swings. It has been virtually impossible to swing trade and I have avoided it completely.
But markets do not stay tough forever and the Nikkei is always on my list of potential trading vehicles.
I have drawn in a very solid trendline which has a good PPP (prior pivot point) and several accurate touch points. The overshoots in June 2013 spoil the perfect picture, but last month's decline was stopped right at the line. Isn't that pretty?
This means that I have a reliable line of support and now I can go find its partner tramline with confidence.
Proof that markets have memories
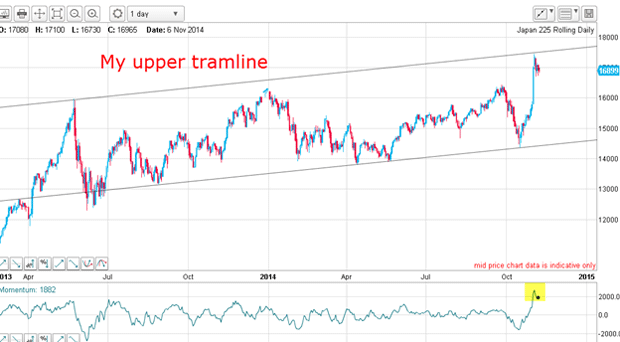
What I have just described is, in fact, the basis of my tramline method. First, I find a reliable trendline and then go searching for a parallel line that turns into a tramline.

And here it is. My upper line touches the spike high of last summer and now it has been hit on the nose by last week's Shinzo Abe rocket. But the resistance of this line was sufficient to stop the rally in its tracks at least for now.
This starkly demonstrates that markets have memories. How did it know where to stop? It must have remembered the summer 2013 high and laid down the resistance line long before last week's spike move!
The sheer velocity of the ascent last week had me thinking: short squeeze. A rally of this magnitude is usually formed from a combination of new buying and short covering.
As Bloomberg reported:"Oct. 31 Bears picked the wrong day to bet against Japan stocks. After the ratio of short sales on Tokyo's exchange yesterday rose to a record high, the Topix (Tokyo price index) today posted its steepest jump since June 2013.
"The Topix today gained 4.3 percent, while the Nikkei 225 Stock Average advanced 4.8 percent to its highest in seven years."
Because short positions were the highest on record, the market was ideally primed for a massive squeeze and delivered it in spades.
Is a wedge forming?
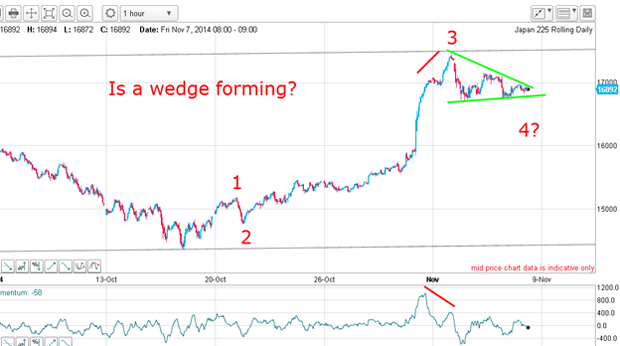
Now let's get a closer look on the hourly:

The rally off the October low has the typical form of a 1-2-3, because wave 3 is long and strong. Remember, whenever you see a vigorous move on very high/low momentum, it will likely be a third wave. You can then work back to see if you can fit waves 1 and 2. I certainly could here.
Note the large negative-momentum divergence at the wave 3 high. This is often a signal that the wave is terminating and to get ready for a pull-back. And the nature of the pull-back should give a clue as to the near-term direction.
In fact, wave 4 is shaping up to be a wedge, which is a typical complex fourth wave pattern. So far, so good. The move out of the wedge should be sharp.
But ideally, I would like to see an A-B-C in this wave 4 position, which implies another dip below my lower wedge line. And following that, the market should rally in wave 5 and then challenge the upper line again.
But there is an alternate scenario. It is that the rally is in reality an A-B-C with a very large C wave. But because waves A and C diverge on scale, I place this alternative at lower odds.
If the market does form an A-B-C in this fourth wave, I shall be looking to go long to ride the fifth wave up. If I have it correct, this fifth wave should move above the wave 3 high, giving me a potential profit estimate.
Get the latest financial news, insights and expert analysis from our award-winning MoneyWeek team, to help you understand what really matters when it comes to your finances.
John is is a British-born lapsed PhD physicist, who previously worked for Nasa on the Mars exploration team. He is a former commodity trading advisor with the US Commodities Futures Trading Commission, and worked in a boutique futures house in California in the 1980s.
He was a partner in one of the first futures newsletter advisory services, based in Washington DC, specialising in pork bellies and currencies. John is primarily a chart-reading trader, having cut his trading teeth in the days before PCs.
As well as his work in the financial world, he has launched, run and sold several 'real' businesses producing 'real' products.
-
 MoneyWeek Talks: The funds to choose in 2026
Podcast Fidelity's Tom Stevenson reveals his top three funds for 2026 for your ISA or self-invested personal pension
-
 Three companies with deep economic moats to buy now
Opinion An economic moat can underpin a company's future returns. Here, Imran Sattar, portfolio manager at Edinburgh Investment Trust, selects three stocks to buy now