Get the latest financial news, insights and expert analysis from our award-winning MoneyWeek team, to help you understand what really matters when it comes to your finances.
You are now subscribed
Your newsletter sign-up was successful
Want to add more newsletters?

Twice daily
MoneyWeek
Get the latest financial news, insights and expert analysis from our award-winning MoneyWeek team, to help you understand what really matters when it comes to your finances.

Four times a week
Look After My Bills
Sign up to our free money-saving newsletter, filled with the latest news and expert advice to help you find the best tips and deals for managing your bills. Start saving today!
Welcome back.
This week, we look at Joe Biden’s $1.9trn stimulus plan and ask whether it will fuel inflation around the globe – and what you should do about it. Cris Heaton looks at Vietnam, one of our favourite emerging markets that’s shaking off the Covid-19 crisis and looking better than ever. And David Stevenson looks at how the fast-growing cannabis industry is getting along, and how you can buy into it. If you’re not already a subscriber, sign up now and get your first six mags (plus a beginner’s guide to bitcoin) free.
Our latest “Too Embarrassed To Ask” video looks at the two main types of pension scheme you’re likely to find yourself in – defined benefits and defined contributions – and what the difference is between the two Find out more about it in our video here.
MoneyWeek
Subscribe to MoneyWeek today and get your first six magazine issues absolutely FREE

Sign up to Money Morning
Don't miss the latest investment and personal finances news, market analysis, plus money-saving tips with our free twice-daily newsletter
Don't miss the latest investment and personal finances news, market analysis, plus money-saving tips with our free twice-daily newsletter
No guests in our podcast this week; it’s just John and Merryn chatting about the “great rotation” out of high-priced growth stocks, the likes of which you’ll find in the Nasdaq index, and into the cheaper, more unfashionable value stocks that you might find in the FTSE 100. They also talk about the new wave of young, tech-savvy investors dropping spare cash on stocks via their smartphone apps and wonder if they’re in the market to stay – and how they might affect it if they are. Have a listen to what they’ve got to say here.
Here are the links for this week’s editions of Money Morning and other web stories you may have missed.
- Monday: Here’s why Saudi Arabia is no longer worried about shale oil
- Monday web article: The key update that could send cryptocurrency ether even higher
- Tuesday: Should you invest in the Deliveroo IPO?
- Wednesday: The next big bull market in metals? Look no further than tin
- Wednesday web article: What is the pensions lifetime allowance and should you be worried about hitting it?
- Thursday: Short-term inflation is almost certain. But what could make it a long-term problem?
- Thursday web article: What Joe Biden’s $1.9trn stimulus plan means for the US
- Friday: Expect more turbulence as the market calls central bankers’ bluff
- Friday web article: Will Britain’s first 40-year fixed-rate mortgage tempt buyers?
Now for the charts of the week.
The charts that matter
Gold rallied a little, but the downward trend may continue for a while yet.
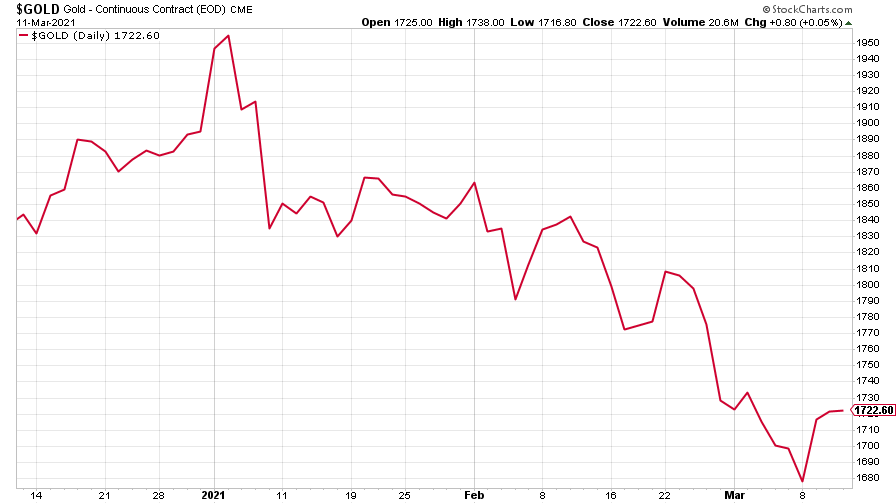
(Gold: three months)
The US dollar index (DXY – a measure of the strength of the dollar against a basket of the currencies of its major trading partners) took fright and plummeted after hitting a three-month high last week.
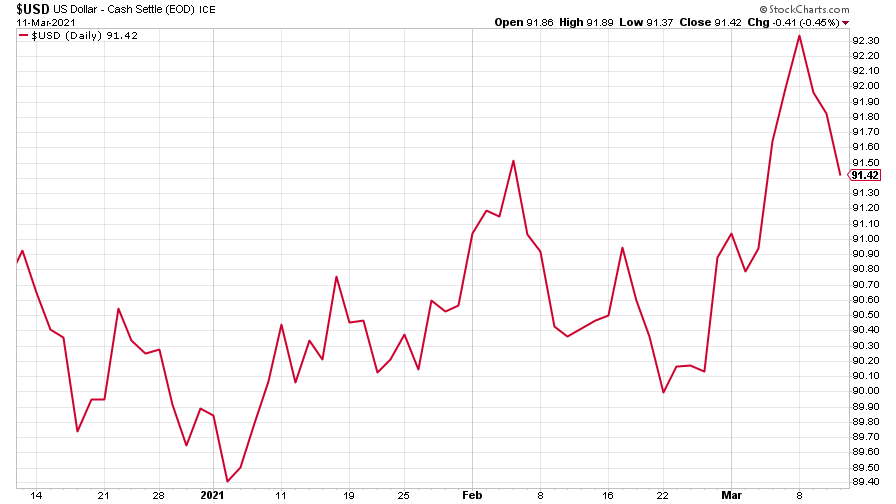
(DXY: three months)
Despite that, the Chinese yuan (or renminbi) started to weaken against the dollar (when the red line is falling, the yuan is strengthening).
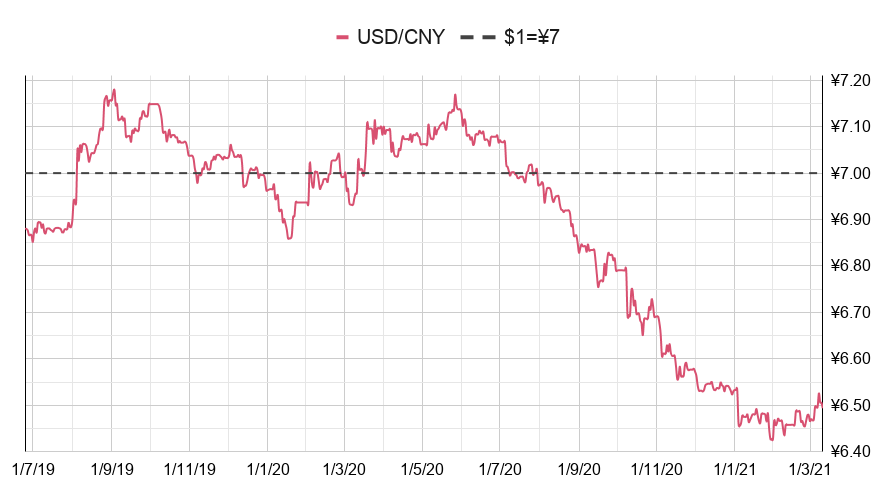
(Chinese yuan to the US dollar: since 25 Jun 2019)
The yield on the ten-year US government bond stabilised.
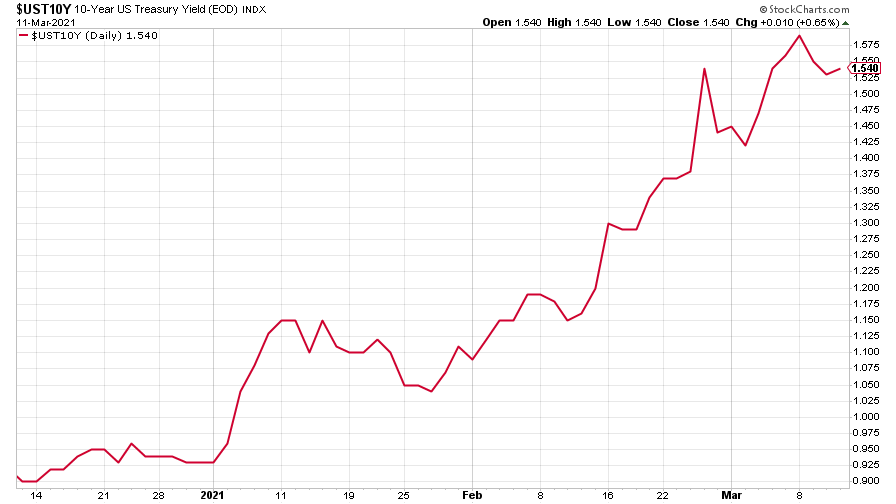
(Ten-year US Treasury yield: three months)
The yield on the Japanese ten-year bond dropped back from last week’s little recovery.
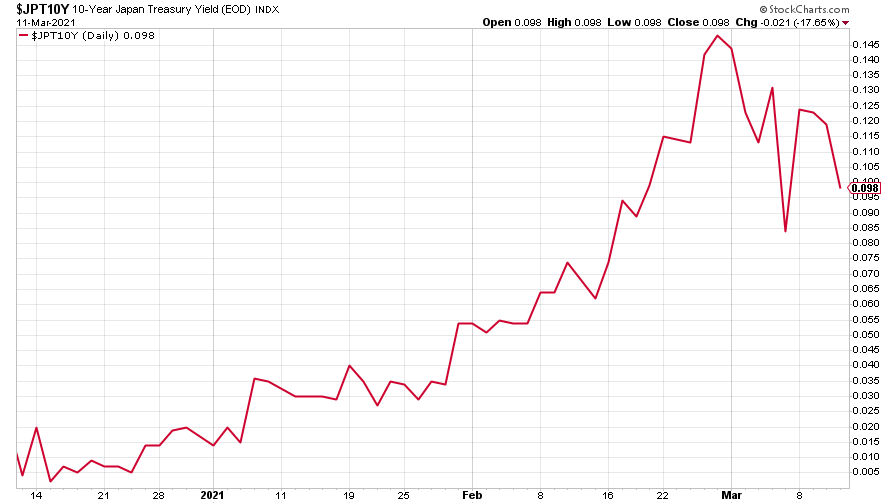
(Ten-year Japanese government bond yield: three months)
And the yield on the ten-year German Bund also dropped back.
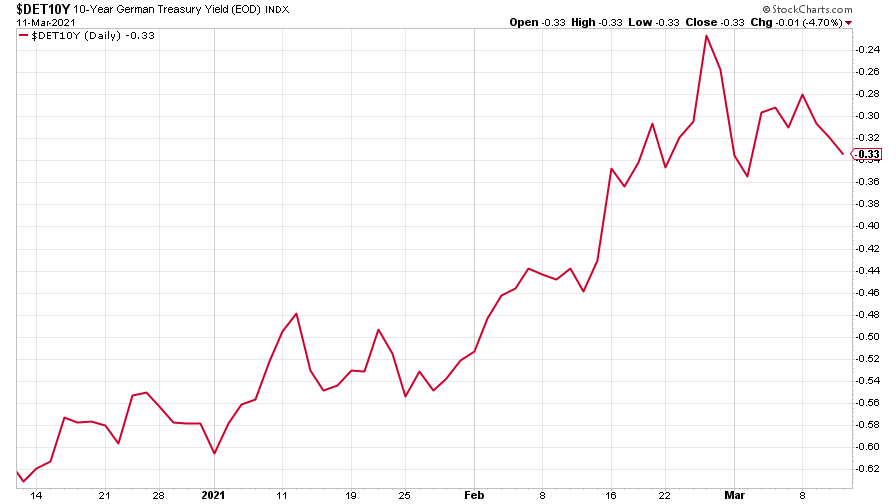
(Ten-year Bund yield: three months)
Copper stopped its recent slide and could be back on the rise. It’s likely to remain in high demand as the world comes out of lockdown to buy shiny new electric cars and suchlike.
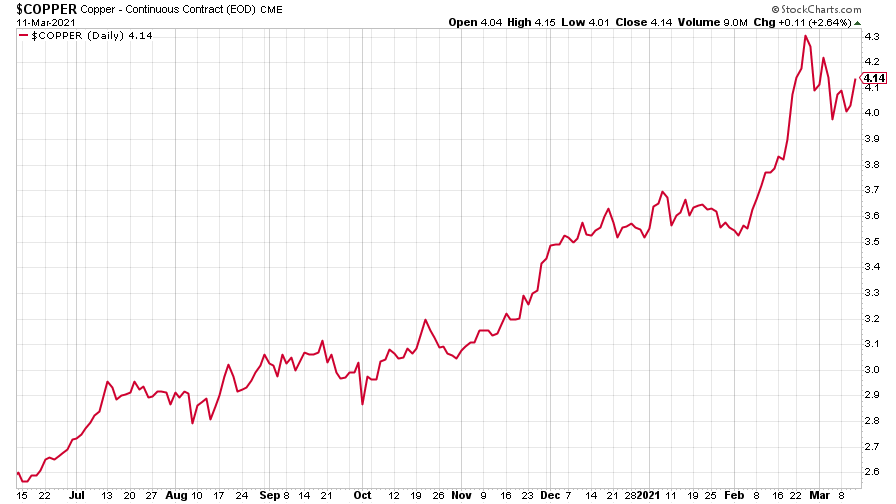
(Copper: nine months)
The Aussie dollar – highly driven by commodity prices – turned back up too.

(Aussie dollar vs US dollar exchange rate: three months)
Cryptocurrency bitcoin is back heading to the moon, doubtless driven by all the digital art NFT mania currently sweeping the globe.
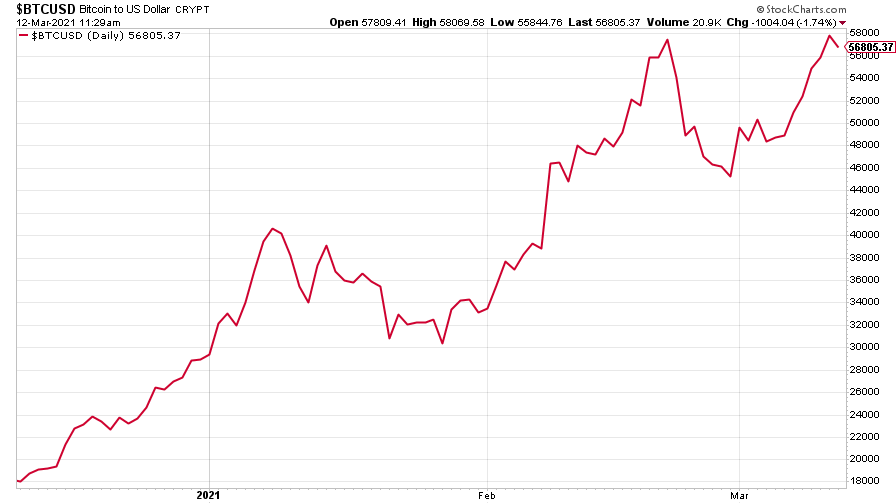
(Bitcoin: three months)
US weekly jobless claims fell by 42,000 to 712,000, compared to 754,000 last week (revised up from 745,000). The four-week moving average fell to 759,000 from 793,000 (which was revised up from 790,750) the week before.

(US jobless claims, four-week moving average: since Jan 2020)
The oil price (as measured by Brent crude) corrected its correction, getting back on course.
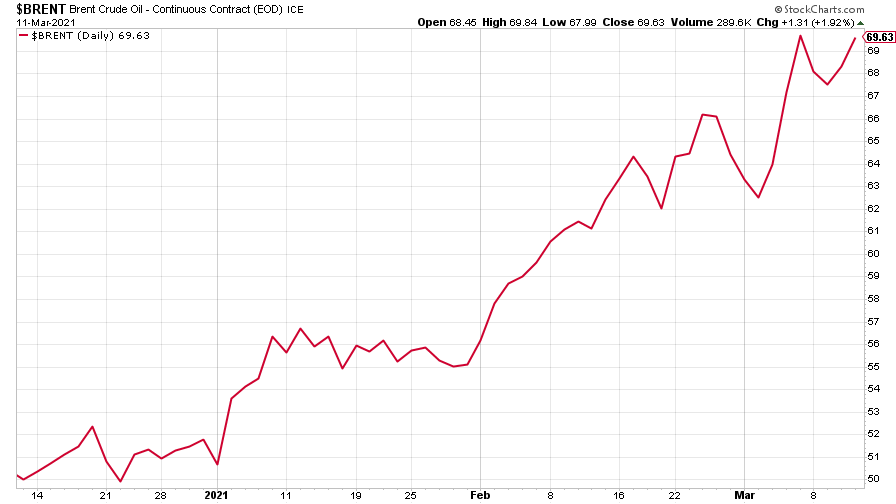
(Brent crude oil: three months)
Amazon bounced back quite fiercely. There is some speculation that the Nasdaq rally is being driven by hedge funds covering their short positions, according to Bloomberg.
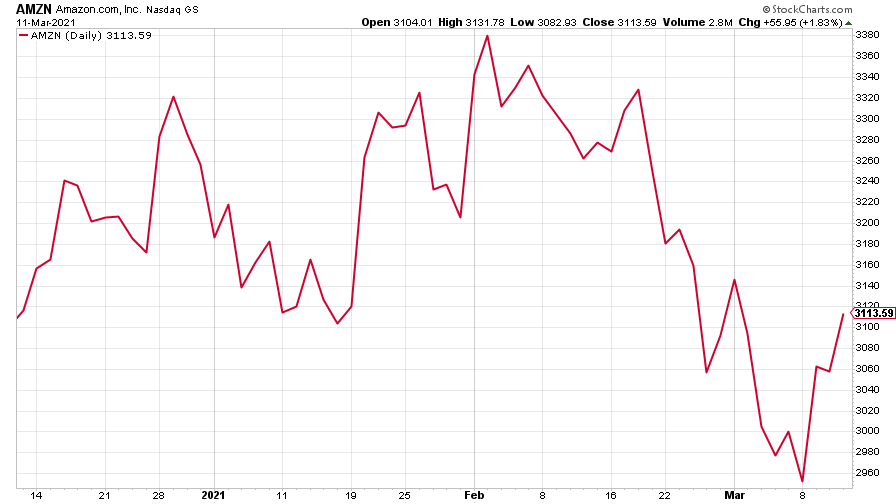
(Amazon: three months)
Tesla bounced along, too.
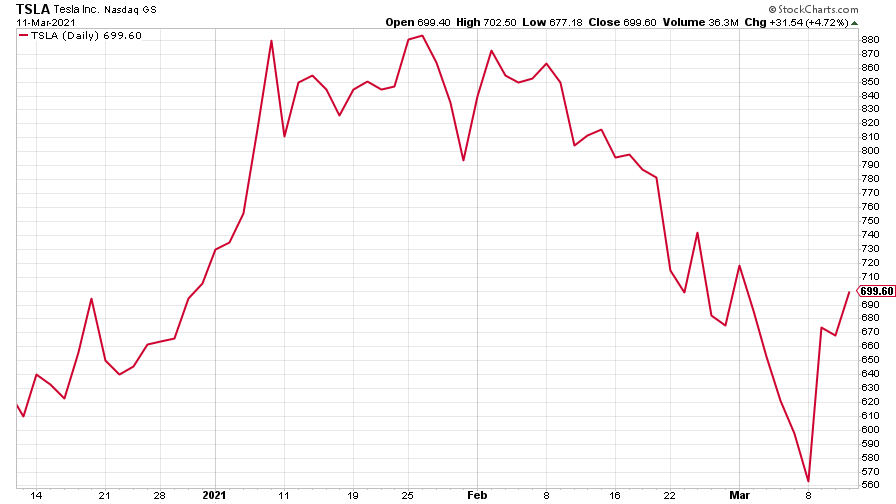
(Tesla: three months)
Have a great weekend.
Ben
Get the latest financial news, insights and expert analysis from our award-winning MoneyWeek team, to help you understand what really matters when it comes to your finances.

-
 Can mining stocks deliver golden gains?
With gold and silver prices having outperformed the stock markets last year, mining stocks can be an effective, if volatile, means of gaining exposure
-
 8 ways the ‘sandwich generation’ can protect wealth
People squeezed between caring for ageing parents and adult children or younger grandchildren – known as the ‘sandwich generation’ – are at risk of neglecting their own financial planning. Here’s how to protect yourself and your loved ones’ wealth.
-
 UK wages grow at a record pace
The latest UK wages data will add pressure on the BoE to push interest rates even higher.
-
 Trapped in a time of zombie government
It’s not just companies that are eking out an existence, says Max King. The state is in the twilight zone too.
-
 America is in deep denial over debt
The downgrade in America’s credit rating was much criticised by the US government, says Alex Rankine. But was it a long time coming?
-
 UK economy avoids stagnation with surprise growth
Gross domestic product increased by 0.2% in the second quarter and by 0.5% in June
-
 Bank of England raises interest rates to 5.25%
The Bank has hiked rates from 5% to 5.25%, marking the 14th increase in a row. We explain what it means for savers and homeowners - and whether more rate rises are on the horizon
-
 UK inflation remains at 8.7% ‒ what it means for your money
Inflation was unmoved at 8.7% in the 12 months to May. What does this ‘sticky’ rate of inflation mean for your money?
-
 Would a food price cap actually work?
Analysis The government is discussing plans to cap the prices of essentials. But could this intervention do more harm than good?
-
 Is my pay keeping up with inflation?
Analysis High inflation means take home pay is being eroded in real terms. An online calculator reveals the pay rise you need to match the rising cost of living - and how much worse off you are without it.
