Get the latest financial news, insights and expert analysis from our award-winning MoneyWeek team, to help you understand what really matters when it comes to your finances.
You are now subscribed
Your newsletter sign-up was successful
Want to add more newsletters?

Twice daily
MoneyWeek
Get the latest financial news, insights and expert analysis from our award-winning MoneyWeek team, to help you understand what really matters when it comes to your finances.

Four times a week
Look After My Bills
Sign up to our free money-saving newsletter, filled with the latest news and expert advice to help you find the best tips and deals for managing your bills. Start saving today!
Welcome back.
In this week’s MoneyWeek podcast, Merryn talks to Hamish Baillie of Ruffer. Hamish tells Merryn why the investment landscape has changed, and a traditional 60/40 equities/bonds split portfolio isn’t likely to cut it any more. That’s one of the reasons he’s bought into bitcoin in quite a big way, and why he’s still a fan of gold. Listen here.
In this week’s issue of the magazine, Matthew looks at hearing technology. It’s an often ignored part of the health sector, but it is about to move into the limelight and there have been some exciting developments. We also look at how to boost Britain's stricken economy, and look at how to buy into the potential of US small-cap stocks. Subscribe now to get your first six mags free.
MoneyWeek
Subscribe to MoneyWeek today and get your first six magazine issues absolutely FREE

Sign up to Money Morning
Don't miss the latest investment and personal finances news, market analysis, plus money-saving tips with our free twice-daily newsletter
Don't miss the latest investment and personal finances news, market analysis, plus money-saving tips with our free twice-daily newsletter
Our latest “Too Embarrassed To Ask” video looks at the difference between monetary policy and fiscal policy, the two main tools available to governments and central banks for influencing a country's economic growth. Find out more in a couple of short minutes by watching our video here.
Here are the links for this week’s editions of Money Morning and other web stories you may have missed.
- Monday: Japanese stocks have hit a new milestone – one not seen since 1990
- Merryn’s blog: Passive investors beware: you may be dangerously overexposed to big tech stocks
- Tuesday: Is the oil price heading for $100 again?
- Wednesday: It's looking toppy out there – what could pop the market bubble?
- Thursday: What is the “Great Reset” – and how do you invest?
- Friday: What rising interest rates and inflation will do to markets
Now for the charts of the week.
The charts that matter
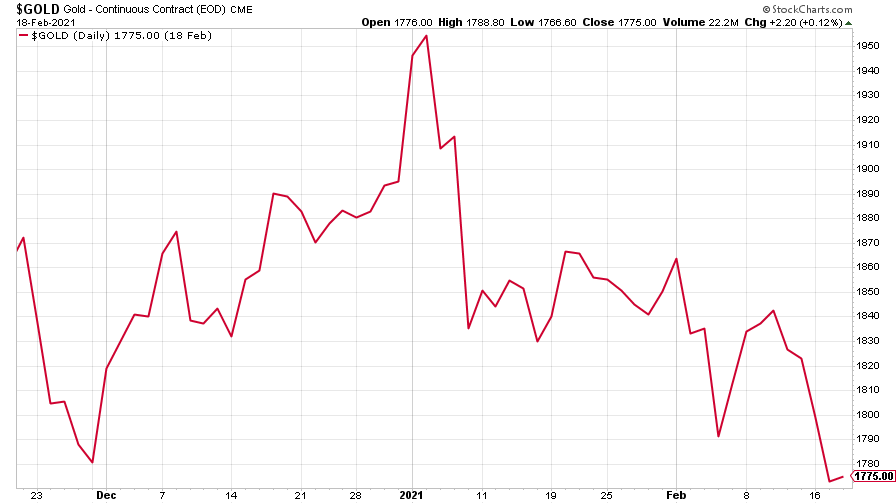
Gold fell to its lowest since March last year, as interest rates start to rise faster than inflation expectations.
(Gold: three months)
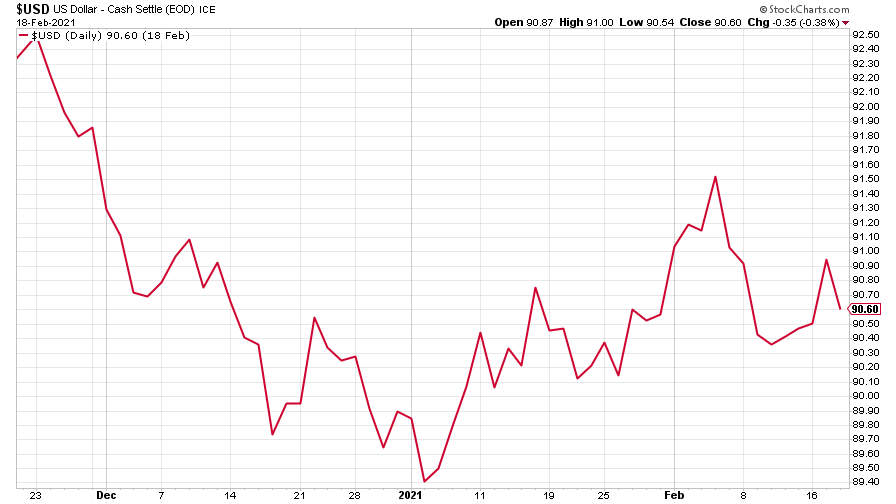
The US dollar index (DXY – a measure of the strength of the dollar against a basket of the currencies of its major trading partners) arrested its recent decline.
(DXY: three months)
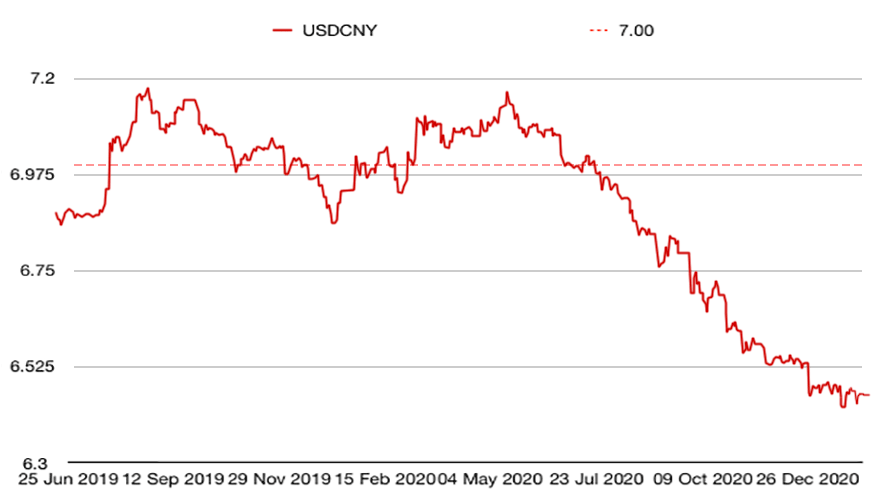
The Chinese yuan (or renminbi) continued broadly flat against the US dollar (when the red line is falling, the yuan is strengthening).
(Chinese yuan to the US dollar: since 25 Jun 2019)
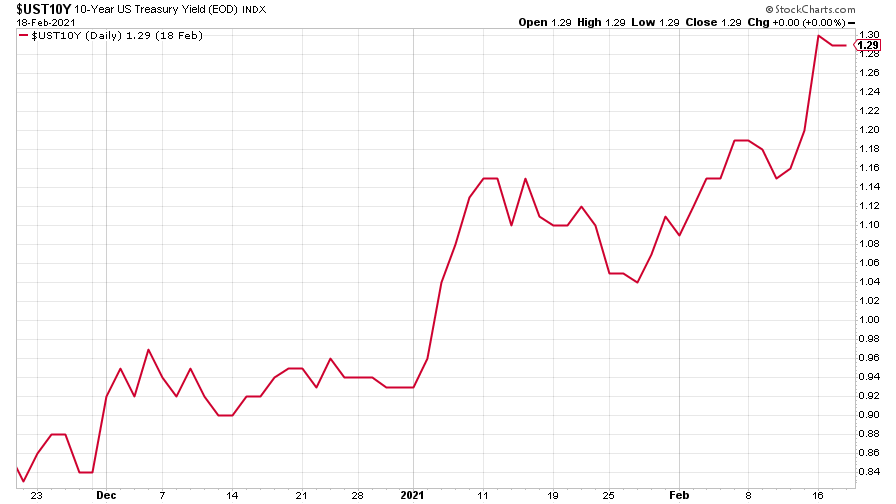
The yield on the ten-year US government bond shot up to almost 1.3% as investors buy in to the “reflation” story – the belief that economic growth is coming back. According to Bloomberg, this is the worst start of a year for bond investors since 2013.
(Ten-year US Treasury yield: three months)
The yield on the Japanese ten-year bond remains low but has shot up – by its standards at least – and now sits at the dizzying height of almost 0.09%.
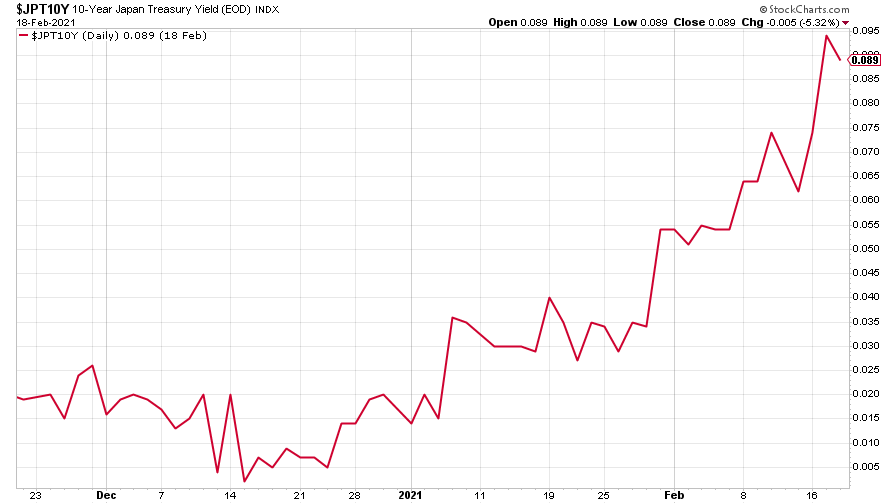
(Ten-year Japanese government bond yield: three months)
And, in a week when the German government auctioned some 30-year Bunds for a whopping 0.1%, the yield on the ten-year German Bund crept higher too. Still not positive, but the highest it’s been for some while.
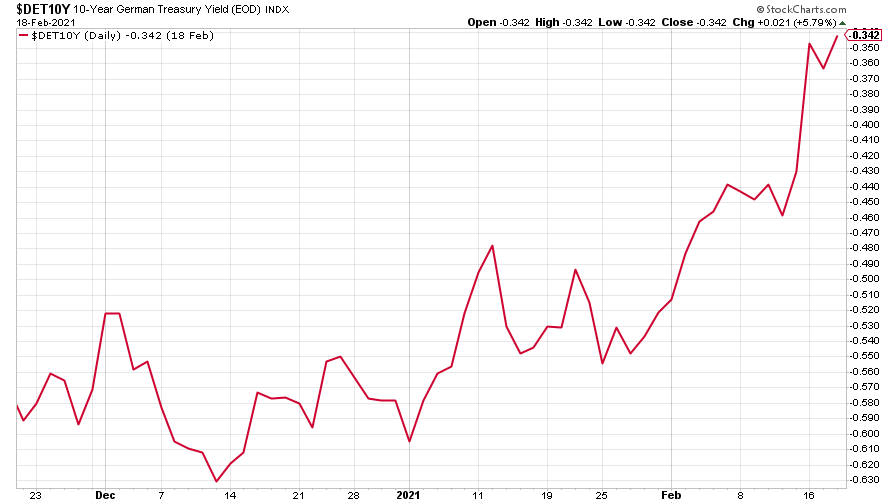
(Ten-year Bund yield: three months)
Copper continued its rise as the new commodities supercycle story gathers pace.
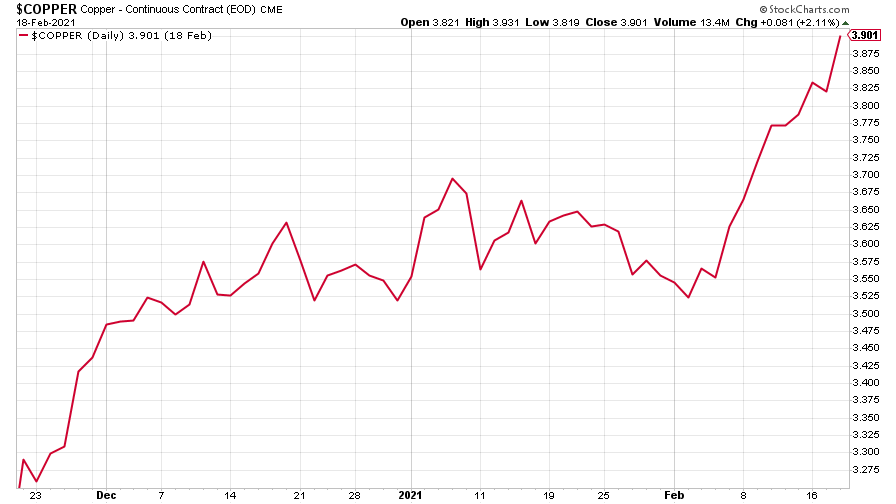
(Copper: nine months)
And the Aussie dollar headed slightly higher on the back of stronger commodities, too.
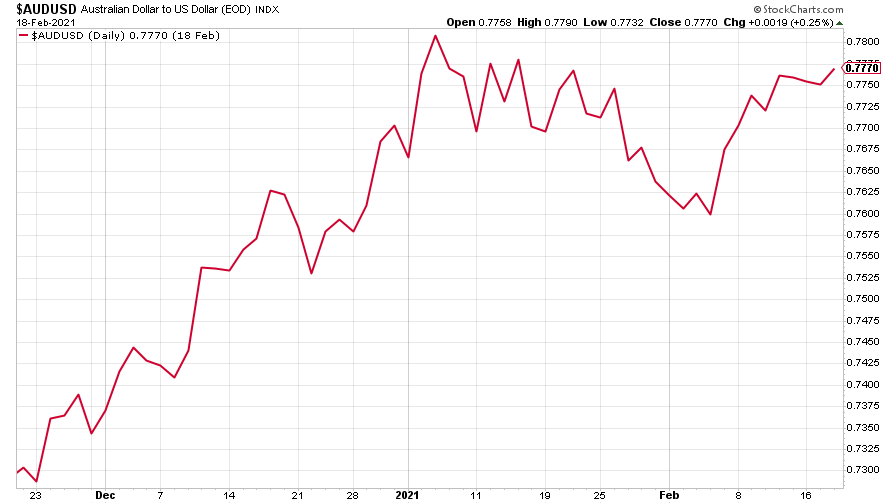
(Aussie dollar vs US dollar exchange rate: three months)
Cryptocurrency bitcoin continues its seemingly unstoppable rise as it becomes increasingly mainstream. Ruffer’s Hamish Baillie tells Merryn in this week’s podcast why he bought a big chunk of it not so long ago. Listen to that conversation here.
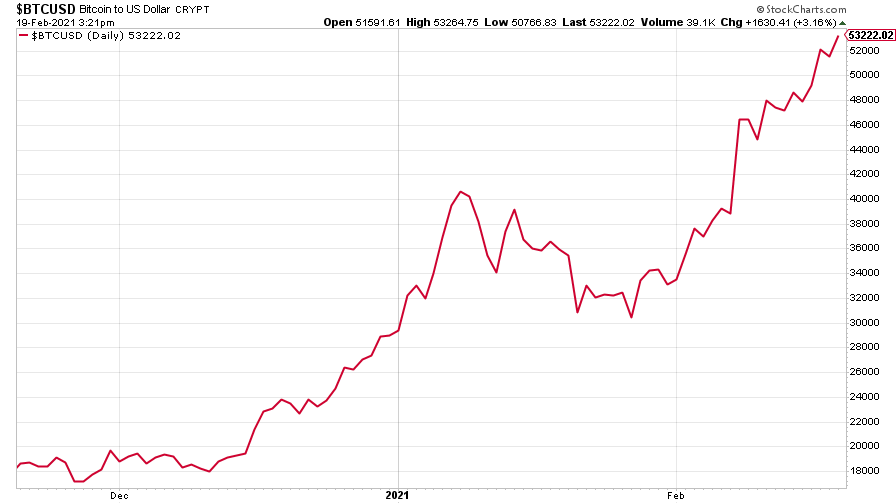
(Bitcoin: three months)
US weekly jobless claims rose to 861,000, compared to 848,000 last week (revised up from 793,000) – a four-week high and almost 100,000 more than analysts had expected in a Reuters poll. The four-week moving average fell by 3,500 to 833,250 from 836,750 (revised up from 823,000) the week before.
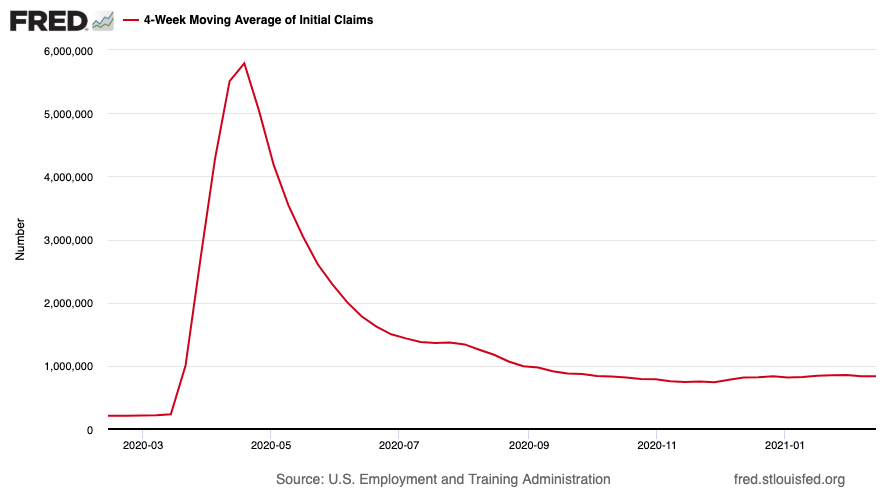
(US jobless claims, four-week moving average: since Jan 2020)
The oil price (as measured by Brent crude) jumped even higher this week to just over $64, before dropping back a little at the end of the week.
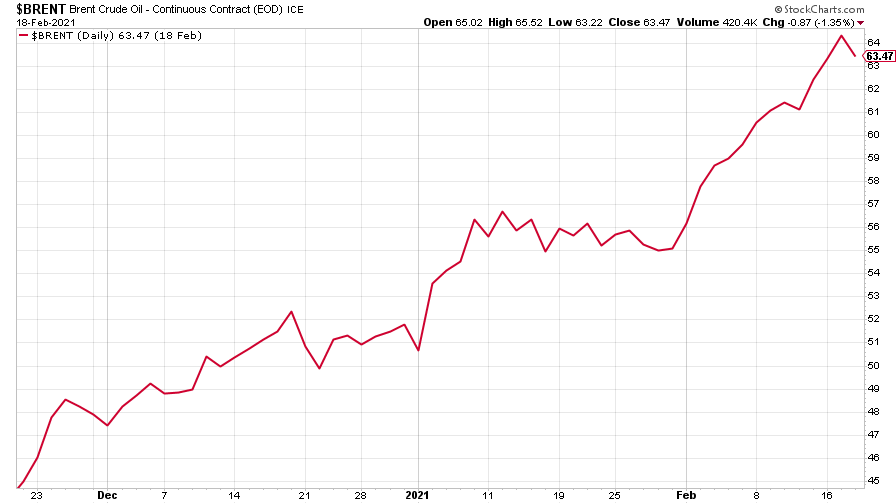
(Brent crude oil: three months)
Amazon recovered some of last week’s losses.
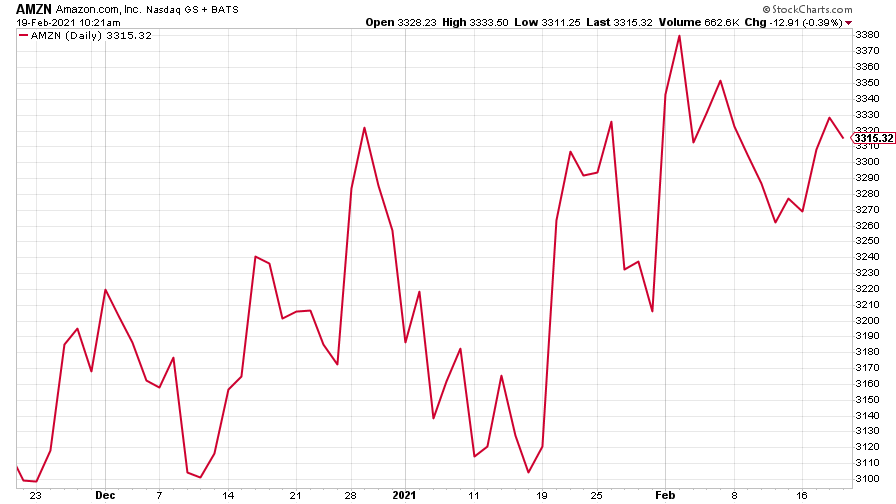
(Amazon: three months)
Tesla slipped this week, too and looks to be drifting lower – something that could easily accelerate as market conditions turn.
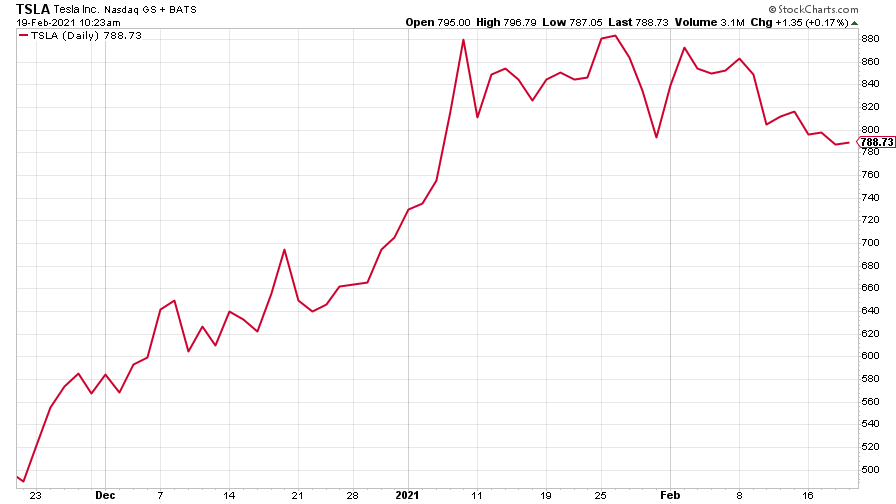
(Tesla: three months)
Have a great weekend.
Ben
Get the latest financial news, insights and expert analysis from our award-winning MoneyWeek team, to help you understand what really matters when it comes to your finances.

-
 MoneyWeek news quiz: Can you get smart meter compensation?
Smart meter compensation rules, Premium Bonds winners, and the Bank of England’s latest base rate decision all made the news this week. How closely were you following it?
-
 Adventures in Saudi Arabia
Travel The kingdom of Saudi Arabia in the Middle East is rich in undiscovered natural beauty. Get there before everybody else does, says Merryn Somerset Webb
-
 UK wages grow at a record pace
The latest UK wages data will add pressure on the BoE to push interest rates even higher.
-
 Trapped in a time of zombie government
It’s not just companies that are eking out an existence, says Max King. The state is in the twilight zone too.
-
 America is in deep denial over debt
The downgrade in America’s credit rating was much criticised by the US government, says Alex Rankine. But was it a long time coming?
-
 UK economy avoids stagnation with surprise growth
Gross domestic product increased by 0.2% in the second quarter and by 0.5% in June
-
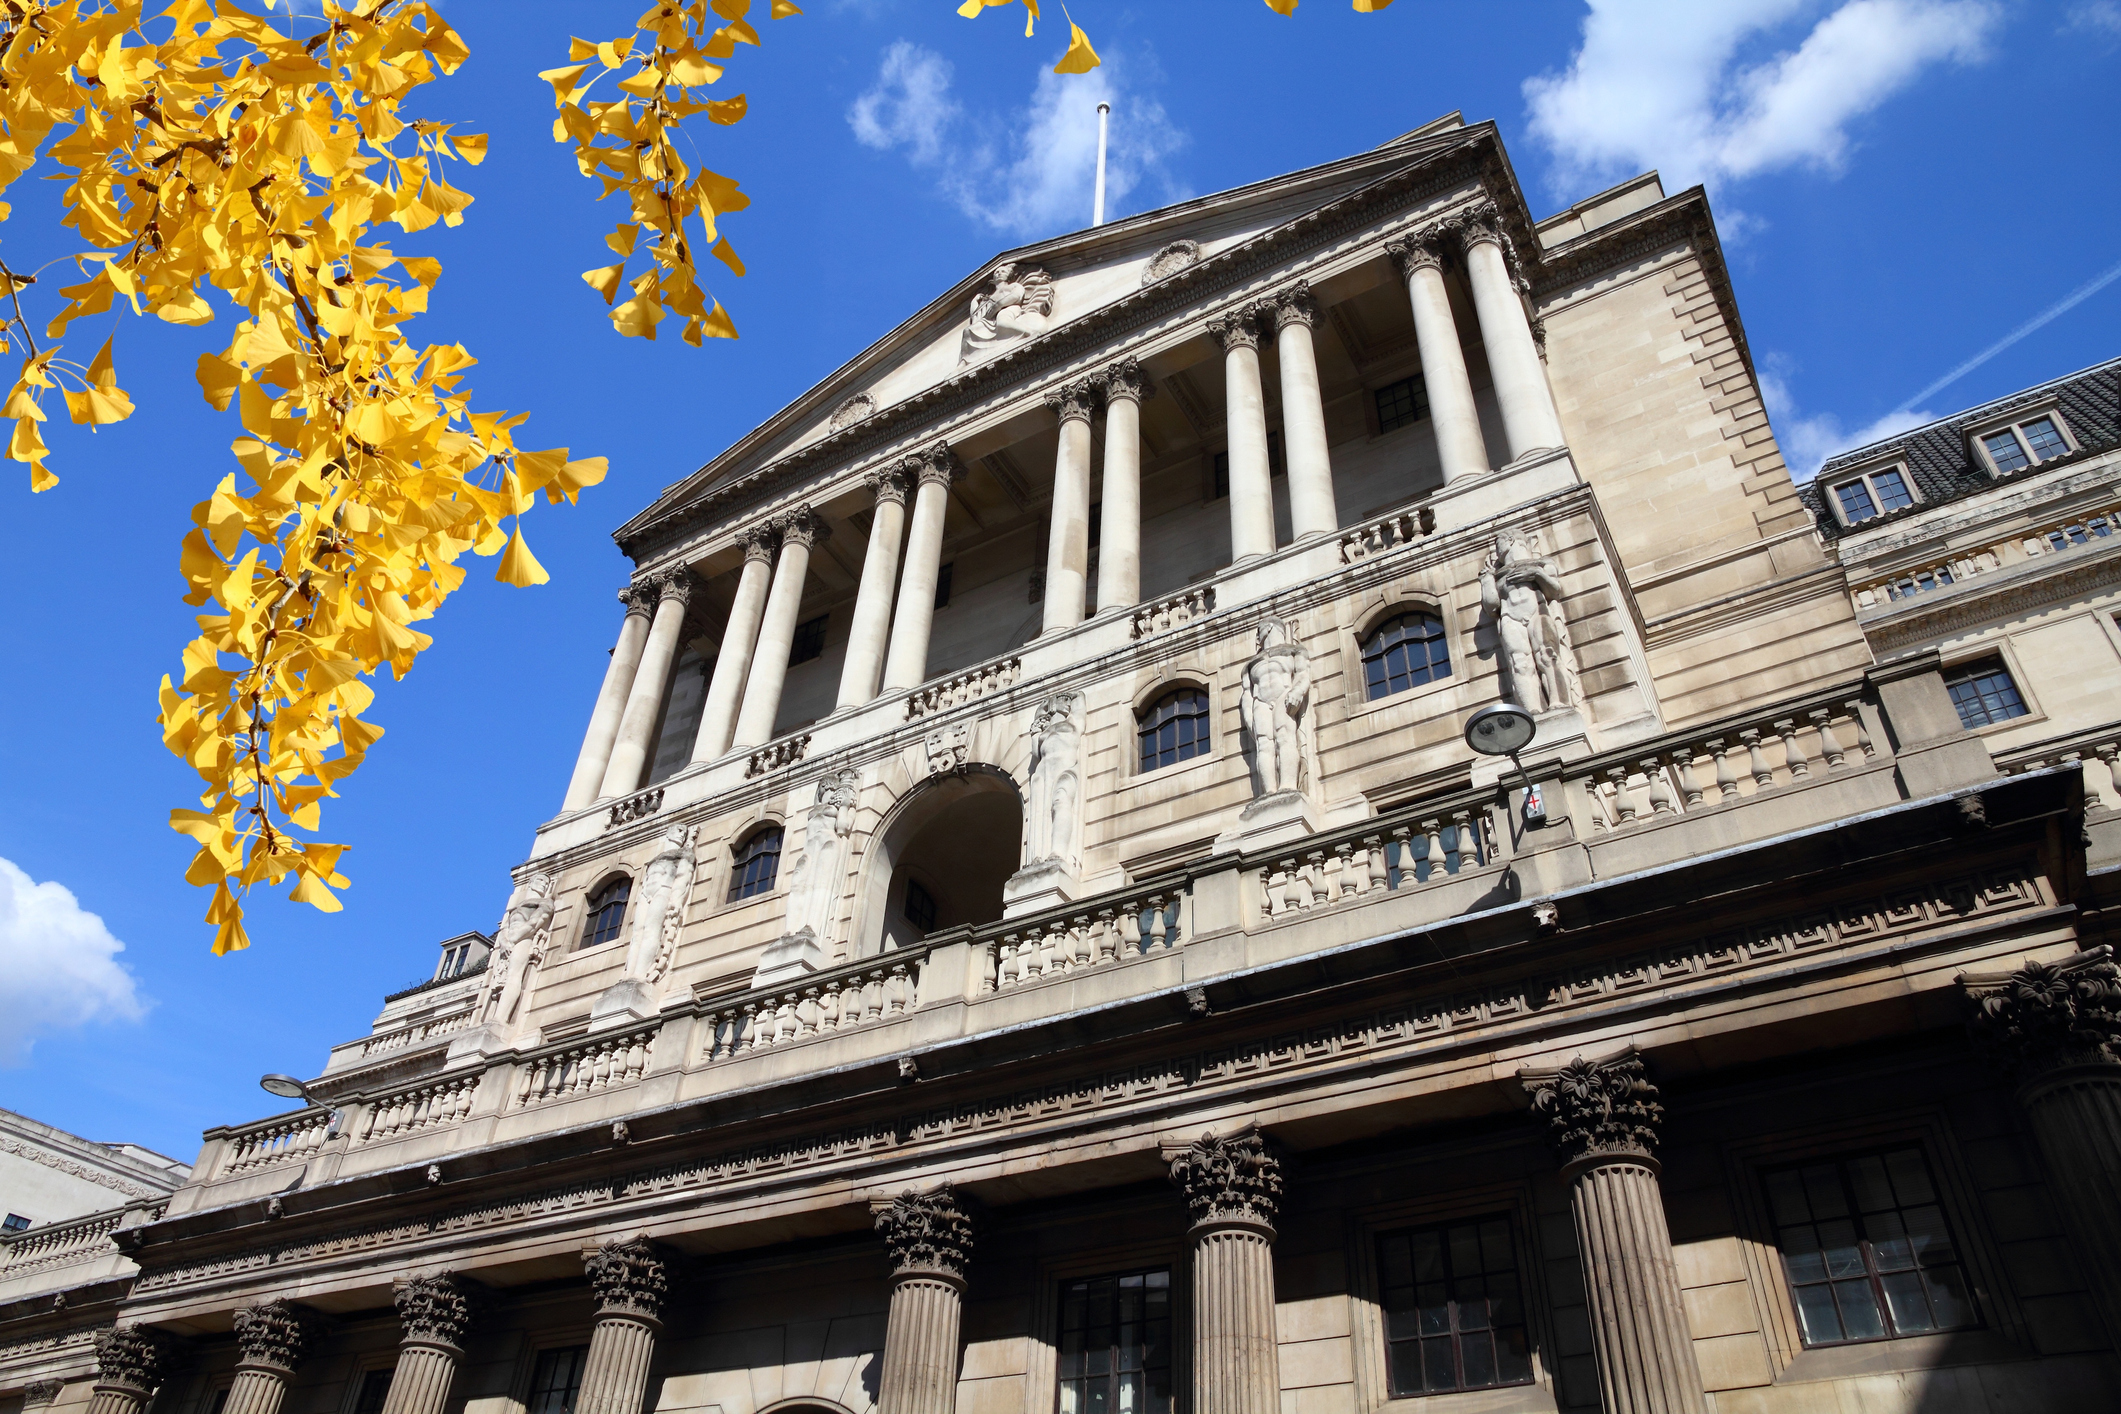 Bank of England raises interest rates to 5.25%
The Bank has hiked rates from 5% to 5.25%, marking the 14th increase in a row. We explain what it means for savers and homeowners - and whether more rate rises are on the horizon
-
 UK inflation remains at 8.7% ‒ what it means for your money
Inflation was unmoved at 8.7% in the 12 months to May. What does this ‘sticky’ rate of inflation mean for your money?
-
 Would a food price cap actually work?
Analysis The government is discussing plans to cap the prices of essentials. But could this intervention do more harm than good?
-
 Is my pay keeping up with inflation?
Analysis High inflation means take home pay is being eroded in real terms. An online calculator reveals the pay rise you need to match the rising cost of living - and how much worse off you are without it.
