Get the latest financial news, insights and expert analysis from our award-winning MoneyWeek team, to help you understand what really matters when it comes to your finances.
You are now subscribed
Your newsletter sign-up was successful
Want to add more newsletters?

Twice daily
MoneyWeek
Get the latest financial news, insights and expert analysis from our award-winning MoneyWeek team, to help you understand what really matters when it comes to your finances.

Four times a week
Look After My Bills
Sign up to our free money-saving newsletter, filled with the latest news and expert advice to help you find the best tips and deals for managing your bills. Start saving today!
Primary equity bear markets to which we are now condemned, commenced from levels where prices were much too high and won't end until prices are much too low. Any premature expectation that the primary bear markets have ended is no more than a false dawn. De-leveraging, the unavoidable consequence of the credit contraction, is far from finished and will continue to create a never ending stream of forced sellers. Major stock markets should fall by as much as another 50%; in which case, FTSE will bottom out below 2,500. As unlikely as that may seem to some, it is no more than should be expected given the unprecedented conditions and the abiding lessons of history.
The above paragraph was first published on 6th November 2008 in issue number 583 and is repeated each fortnight until eventually replaced.
The Fed decided that Citibank was too big to fail, saving it at an initial cost of $300 billion. On the back of frenetic short covering, stock markets rallied; since then the Dow has been up for seven of the last eight sessions. It has to be said however, that the one down day, Monday 1st December, was the second biggest percentage decline this year.
MoneyWeek
Subscribe to MoneyWeek today and get your first six magazine issues absolutely FREE

Sign up to Money Morning
Don't miss the latest investment and personal finances news, market analysis, plus money-saving tips with our free twice-daily newsletter
Don't miss the latest investment and personal finances news, market analysis, plus money-saving tips with our free twice-daily newsletter
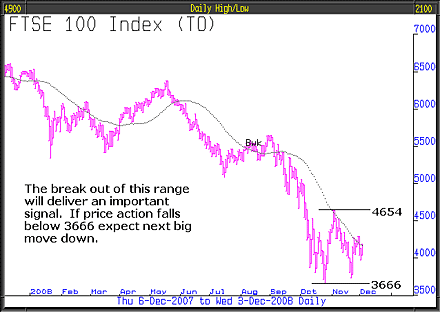
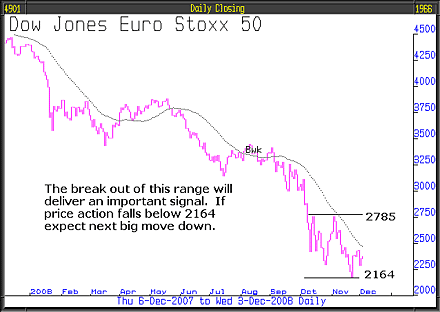
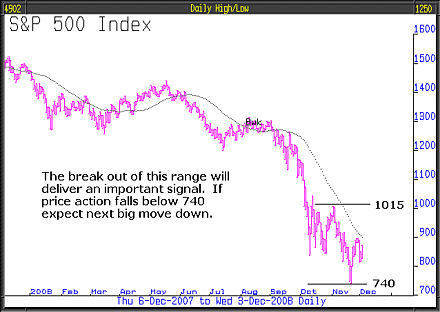
Volatility remains a huge issue, the greater the volatility, the greater the risk the stakes remain very high. Below are charts of three major stock market indices, the latest price action is a form of consolidation taking place at the recent primary bear market lows. The charts clearly illustrate the importance of the next short-term signal.


This past two weeks has seen further cases of "fall off a cliff syndrome". Whilst these continue, there can be little hope of any meaningful reversal in stock market behaviour. The likelihood that all the bad news is already priced into the market is minimal and because of that, inevitable further shocking data will trigger the next journey south which, if our reading is correct, ought to result in stock markets finding their eventual lows, about 50% below current levels. Evidence of this nightmare scenario has been endorsed these last two weeks by the extraordinary strength of long-dated government bonds. Yields have plunged to 50-year lows, a sure sign of escalating investor fear.
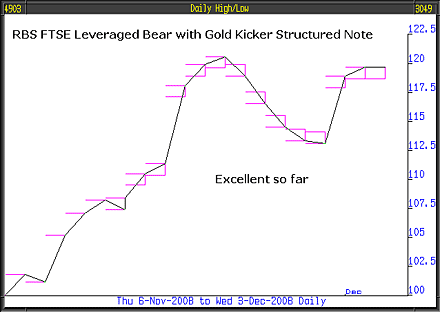
The model portfolio, which previously benefited considerably from holding the SocGen Structured Bear Note is now benefiting from exposure to the RBS Structured Bear Note.

It has been our regular policy to identify the key issues and then routinely report in each successive issue. By focusing on them, our minds can be unclogged, ensuring that critically important developments are recognised early. On the one hand, this will provide confirmation of our view that the economies of the world are going to the centre of the earth taking asset prices with them; the investment profile of the model portfolio is structured to benefit from such an outcome. On the other hand, if our current assessment is wrong, the economic evidence and price action of the market will tell us this. We can then efficiently disengage and invest differently.
It is our policy at all times to reduce risk by investing appropriately for the conditions prevailing, in our mind it is the only common sense way to approach the investment puzzle.
Currently, the four key issues are as follows:
Housing market
In the UK, the outlook remains grim and the incentive to buy remains very weak. Prices are still falling, it's cheaper to rent than to buy. These fundamental facts will need to change before new first-time buyers will be attracted.
As a rule of thumb, it costs about 10% per year to own a house. That's interest, insurance, repairs and if the property is let, vacant periods. If you can rent a house for less than 10% per annum you are winning and the landlord is losing. Once rental yields are 10% or higher, it is cheaper to own than to rent - a simple barometer but one that works well. The derivatives market is predicting that UK house prices will fall another 36% over the next two years!
The government have sprung a surprise by saying that they will provide a mortgage payment lifeline to those with mortgages of up to £400,000 who have suffered significant or temporary loss of income a two-year payment holiday but with the unpaid interest accruing - the details are, as yet, unknown. It is estimated that 9,000 households might benefit. This nowhere near meets the number of possible repossessions next year.
The US authorities are also striving to rescue their housing market. In spite of that, in October the price of previously owned houses fell by the biggest amount in at least 40 years. The median price for existing homes fell 11.3% in October compared to a year before.
It is safe to say that until the house markets have normalised and mortgages are readily available, the whole debt deflation and depression issues will continue unabated and asset prices will continue to decline.
Unemployment
The monthly US non-farm payroll figures will not be out until Friday, too late for this issue too late even for a postscript. The expectation is a much worse figure than last month. If it's worse even than that, the markets could react very badly. The median forecast is a loss 320,000 jobs, this compares to 240,000 in October. What we expect is a revised upward October figure and a very big number for November. Last week in the US, it was reported that 542,000 filed new claims for jobless benefits, this compared to a forecast of 500,000 and was the worst number since the 1930s. We have no doubt that unemployment is set to adversely surprise everybody, it is one of the most important indicators.
The Financial Times reported on Wednesday 3rd December that the demand for redundancy advice has soared and that the fall in permanent and temporary job appointments in November was the biggest monthly decline since the survey of the Recruitment and Employment Confederation (REC) and consultants KPMG began eleven years ago. Yet another of those "worst since" bits of data. Worse still, the increase in the number of people looking for work was also a series record, as was the fall in job vacancies and drop in permanent and temporary salaries. "These figures confirm that the jobs market has hit the wall" said Kevin Green, Chief Executive of REC or, as we would say, "fall off a cliff syndrome", is everywhere. It is an important article, in particular the chart produced by KPMG/REC is extraordinary, showing, as it does, permanent staff availability rocketing and permanent placements plunging - it tells us everything.
Consumer spending
To some extent it's superfluous to talk of the new data and news surrounding this subject because everybody knows what we know and that is that consumer spending is "falling off a cliff". In some sectors it has already collapsed the outlook is grim. Bad house market, poor credit facilities and surging job losses equal plunging consumer spending. We rest our case.
Corporate earnings
Above all others, the outlook for corporate earnings is the big issue, we expect they will also catch "fall off a cliff syndrome". This is the potential scenario which will cause the next stock market decline to get underway and spiral furiously downwards. It's all very simple really, consumers have started a spending strike, so any business that sells to them is heading into a huge headwind. This in itself is probably enough to do the damage but there's more. Credit markets are at worst, closed and at best, much more expensive. Spreads for investment grade corporate bonds are 550 basis points over treasuries; even worse, junk bonds are a huge 20 percentage points above treasuries. This huge additional cost, at a time of tightened lending by banks, is directly undermining companies' ability to deliver profits and pay dividends. Spreads suggest a default rate of 14 times the worst levels of the past 25 years. Today's rating suggests 21% of companies will default over the next twelve months.
Further evidence of the crisis is that bank and building society deposits by non-financial companies fell 5.2% in October, the fastest rate since 1980. This week, low risk, National Grid sold bonds totalling €600 million at 3.5% above the rate banks lend to each other, seven times the pre-credit crunch rate, causing an additional interest rate cost of €17 million per annum.
Looking forward, companies have no option but to slash capital expenditure, which is to say, slash other companies' earnings, a vicious spiral that carries with it so much potential consequence that the Markit iTraxx Crossover Index is above 1000 for the first time since it was created, inferring that a record of number of companies are on the verge of default.
To summarise, these are the four indicators we will watch and specifically report on. As time moves on, the developing conditions will either improve and cause our current views to change, or deteriorate and cause our views to strengthen. For the moment, our money is on the economy getting much worse by an amount, as yet, not priced in by the market.
This article was written by John Robson & Andrew Selsby at Full Circle Asset Management, as published in the threesixty newsletter on 5 December.
Get the latest financial news, insights and expert analysis from our award-winning MoneyWeek team, to help you understand what really matters when it comes to your finances.
MoneyWeek is written by a team of experienced and award-winning journalists, plus expert columnists. As well as daily digital news and features, MoneyWeek also publishes a weekly magazine, covering investing and personal finance. From share tips, pensions, gold to practical investment tips - we provide a round-up to help you make money and keep it.
-
 ISA fund and trust picks for every type of investor – which could work for you?
Whether you’re an ISA investor seeking reliable returns, looking to add a bit more risk to your portfolio or are new to investing, MoneyWeek asked the experts for funds and investment trusts you could consider in 2026
-
 The most popular fund sectors of 2025 as investor outflows continue
It was another difficult year for fund inflows but there are signs that investors are returning to the financial markets

