The charts that matter: Tesla hits a pothole
Electric-car group Tesla has had a rough week. John Stepek looks at what was behind it, and at the rest of the global economy’s most important charts.

Get the latest financial news, insights and expert analysis from our award-winning MoneyWeek team, to help you understand what really matters when it comes to your finances.
You are now subscribed
Your newsletter sign-up was successful
Want to add more newsletters?

Twice daily
MoneyWeek
Get the latest financial news, insights and expert analysis from our award-winning MoneyWeek team, to help you understand what really matters when it comes to your finances.

Four times a week
Look After My Bills
Sign up to our free money-saving newsletter, filled with the latest news and expert advice to help you find the best tips and deals for managing your bills. Start saving today!
Welcome back. As I may have mentioned occasionally this week, my book, The Sceptical Investor, came out on Monday. If you enjoy my writing in Money Morning and MoneyWeek, I hope you'll enjoy the book too.
It's all about the mindset you require to be a contrarian investor. It's aimed at investors of all levels I'm hoping it'll give you a solid mental framework for approaching your investing, as well as plenty of practical tips on how best to go about it.
If you order it now, as a Money Morning and MoneyWeek reader you'll get a 25% discount pick up your copy here.
MoneyWeek
Subscribe to MoneyWeek today and get your first six magazine issues absolutely FREE

Sign up to Money Morning
Don't miss the latest investment and personal finances news, market analysis, plus money-saving tips with our free twice-daily newsletter
Don't miss the latest investment and personal finances news, market analysis, plus money-saving tips with our free twice-daily newsletter
We will have a new podcast for you next week if you missed last week's, Merryn discussed gold with Alasdair McKinnon of The Scottish Investment Trust, and then she and I looked at why you might want to own some. (Now would also be a good time to subscribe to MoneyWeek magazine, for more ideas on what should be in your portfolio during these turbulent times.)
And if you missed any of this week's Money Mornings, here's your chance to catch up.
Monday: What this famous psychologist can teach you about being a better investor
Tuesday: What Theresa May's new deal means for your money
Wednesday: Today, silver looks cheap compared to gold but should you make the trade?
Thursday: For all the noise on Brexit, nothing important has changed
Friday: Forget Trump or Opec here's what really drives the oil price
And now, once again, over to the charts.
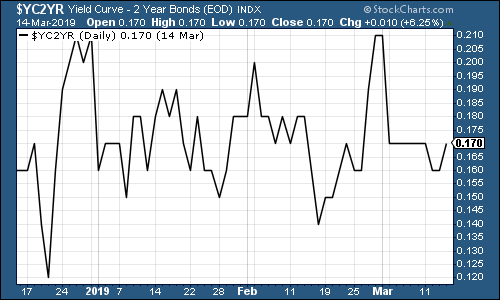
The yield curve (here's a reminder of what it is) hasn't changed much it's still in the danger zone, even although looking at it, some of our other charts are suggesting that "risk-on" is getting back into the driving seat.
The chart below shows the difference (the "spread") between what it costs the US government to borrow money over ten years and what it costs over two. Once this number turns negative, the yield curve has inverted which almost always signals a recession (although perhaps not for up to two years).
Gold (measured in dollar terms) perked up somewhat this week, but also shows signs that investors are yet to be convinced that the global economy is out of the woods yet.
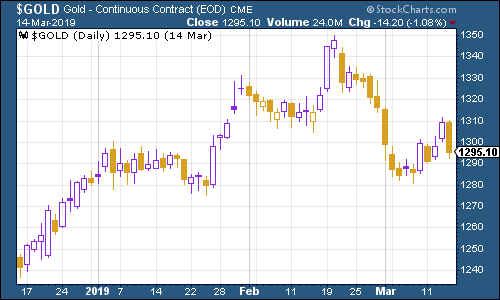
(Gold: three months)
The US dollar index a measure of the strength of the dollar against a basket of the currencies of its major trading partners slipped back from the high it saw after the European Central Bank drove the euro down last week rocketed this week (that's because the euro is the biggest component of this basket).
With the euro recovering somewhat (because markets reckon Brexit has been pushed further down the road towards "Nevergonnahappenville"), you've seen the dollar index slip back. Investors should keep an eye on this a strengthening dollar tends to hurt markets, while a weakening one is usually good news for risk assets.
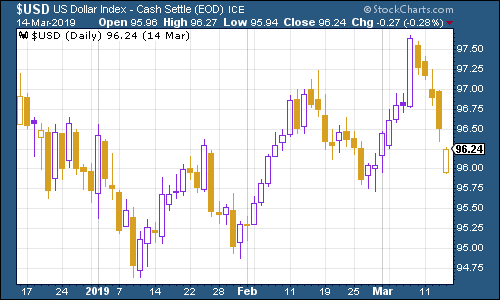
(DXY: three months)
The ten-year yields on the world's major developed market bonds the US, Japan and Germany were little changed on the week although Germany bounced a little amid some Brexit relief and hopes of a China trade deal.
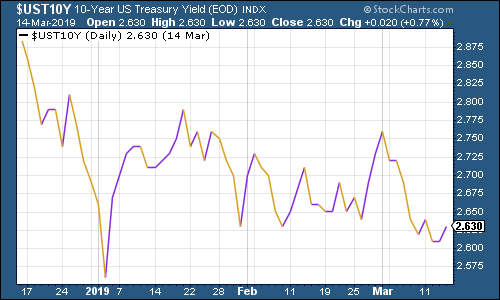
(Ten-year US Treasury yield: three months)
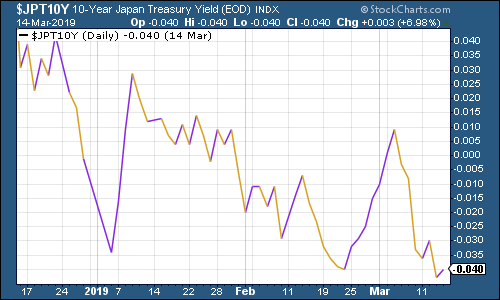
(Ten-year Japanese government bond yield: three months)
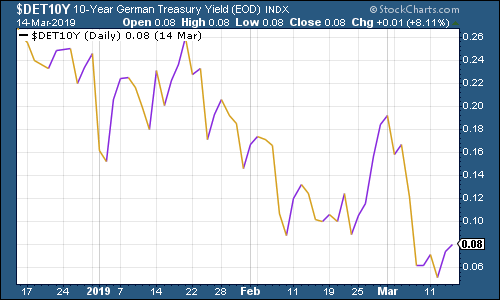
(Ten-year bund yield: three months)
Copper continued to trade sideways this week it's come a long way in a short time so perhaps this is no surprise.
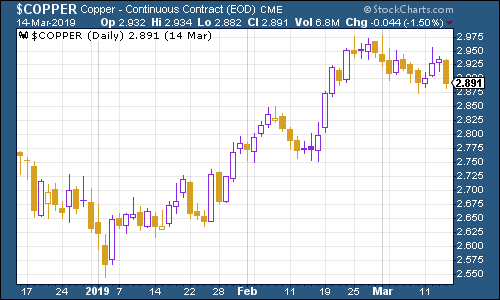
(Copper: three months)
The Aussie dollar our favourite indicator of the state of the Chinese economy bounced from the low it hit last week. Australia's economy isn't in great shape right now, but the Aussie will probably move along with hopes for a trade deal. It's also worth noting that from a technical viewpoint (this is charting territory on which I am no expert, but I'll throw this in here as something to watch), the currency is very near "resistance" in other words, it might take a fair bit of bad news for it to slide convincingly down through the $0.70 mark.
Which is not to say it couldn't happen, of course.
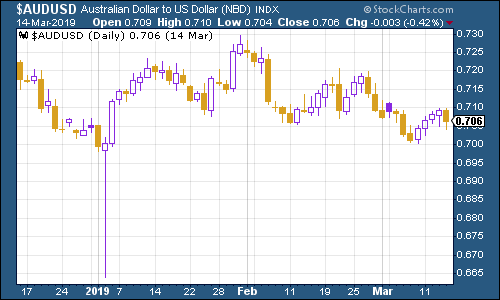
(Aussie dollar vs US dollar exchange rate: three months)
Cryptocurrency bitcoin was range-bound for most of the week, although it was creeping higher towards the end of the week.
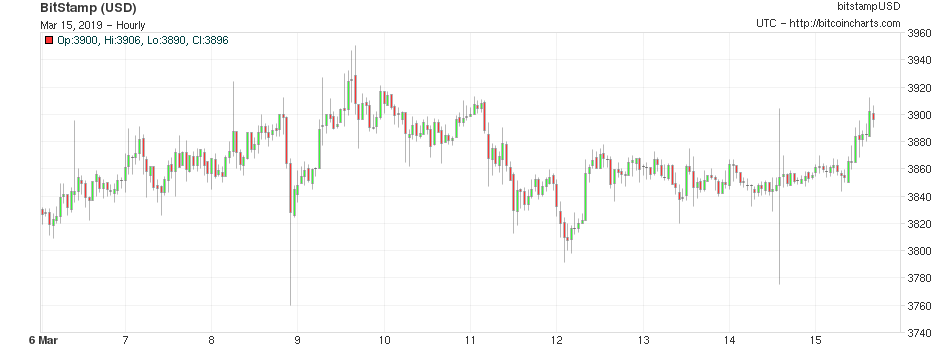
(Bitcoin: ten days)
The four-week moving average of weekly US jobless claims fell back this week, to 223,750, while weekly claims rose by more than expected to 229,000.
Based on the limited sample of historical recessions, David Rosenberg of Gluskin Sheff has pointed out that US stocks typically don't peak until after the aforementioned four-week moving average has hit a low for the cycle. On average, a recession follows about a year later.
The most recent trough came on 15 September, at 206,000. If that was the bottom, it implies that the market has already peaked (which happened in early October, at around 2,950 for the S&P 500), and that a recession may follow this year or in 2020.
From where I'm sitting it looks increasingly likely as though we have already seen the trough on jobless claims. Let's keep an eye on it though.
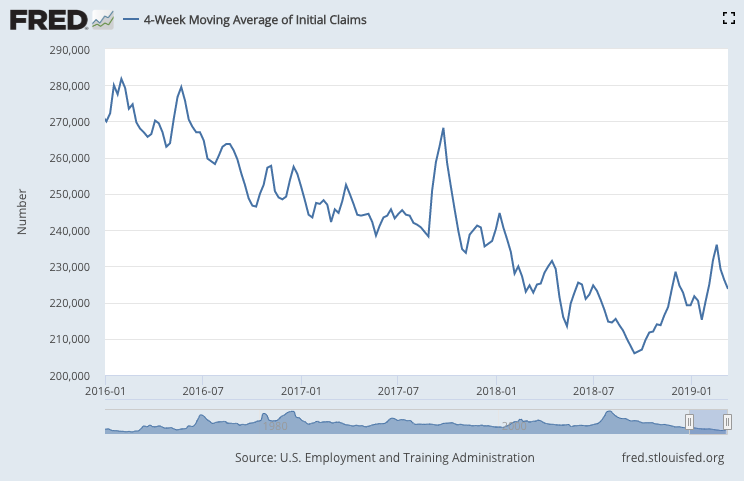
(US jobless claims, four-week moving average: since January 2016)
The oil price (as measured by Brent crude, the international/European benchmark) pushed higher as investors bet that demand plus production cuts will manage to overwhelm the additional supply from US shale oil groups.
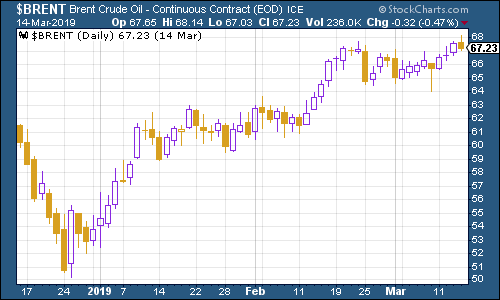
(Brent crude oil: three months)
Internet giant Amazon is looking more promising if it climbs back above the $1,800 mark I think that'll tell us that the market is firmly back in "risk on" mode.
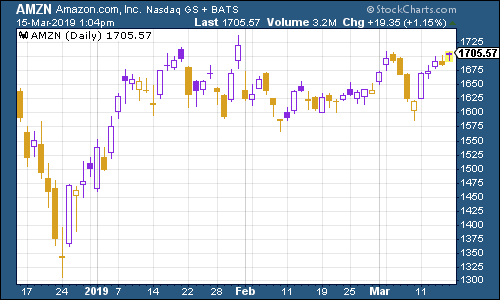
(Amazon: three months)
Electric-car group Tesla, meanwhile, had another rough week. Shares slid on Friday (not included in the chart below) as the "Model Y crossover" utility vehicle was deemed "underwhelming" (clearly it lacked the bonnet-mounted flamethrowers that some might have come to expect from Mr Musk).
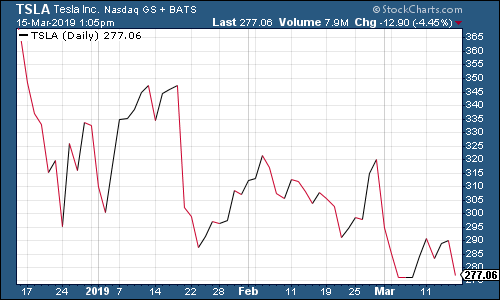
(Tesla: three months)
Get the latest financial news, insights and expert analysis from our award-winning MoneyWeek team, to help you understand what really matters when it comes to your finances.

-
 ISA fund and trust picks for every type of investor – which could work for you?
Whether you’re an ISA investor seeking reliable returns, looking to add a bit more risk to your portfolio or are new to investing, MoneyWeek asked the experts for funds and investment trusts you could consider in 2026
-
 The most popular fund sectors of 2025 as investor outflows continue
It was another difficult year for fund inflows but there are signs that investors are returning to the financial markets