The charts that matter: it’s all about inflation now
Prices are rising in the US, and so far markets have taken it all in their stride, says John Stepek. The assumption is that the Fed won't be making any sudden moves.

Get the latest financial news, insights and expert analysis from our award-winning MoneyWeek team, to help you understand what really matters when it comes to your finances.
You are now subscribed
Your newsletter sign-up was successful
Want to add more newsletters?

Twice daily
MoneyWeek
Get the latest financial news, insights and expert analysis from our award-winning MoneyWeek team, to help you understand what really matters when it comes to your finances.

Four times a week
Look After My Bills
Sign up to our free money-saving newsletter, filled with the latest news and expert advice to help you find the best tips and deals for managing your bills. Start saving today!
Welcome to your weekend edition, where we take a look through the charts that matter and catch up on anything else that we missed during the week.
If you missed any of this week's Money Mornings, here are the links you need:
Monday: How to take advantage of falling markets
MoneyWeek
Subscribe to MoneyWeek today and get your first six magazine issues absolutely FREE

Sign up to Money Morning
Don't miss the latest investment and personal finances news, market analysis, plus money-saving tips with our free twice-daily newsletter
Don't miss the latest investment and personal finances news, market analysis, plus money-saving tips with our free twice-daily newsletter
Tuesday: Here's why you should keep a close eye on tomorrow's US inflation data
Wednesday: Estate agents, housebuilders and the outlook for UK house prices
Thursday: Inflation is picking up in the US and there's more to come
Friday: A warning to us all anyone can fall for investment scams
If you missed the podcast last week, you can listen to it here. We'll have the new one out next week.
The big news this week was inflation.
First, on Wednesday, US consumer price inflation came in higher than expected. Then producer price inflation while within expectations was still rising, and manufacturing surveys revealed that companies are seeing input costs rising sharply.
The market is waking up to this, and so far, it seems mildly relaxed about it. Bonds don't like it; but stocks aren't phased. It seems that investors may be betting (rightly, I suspect) that the Fed won't make any sudden moves.
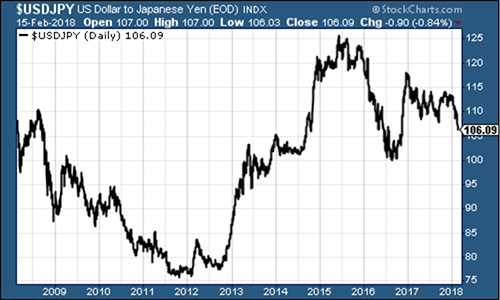
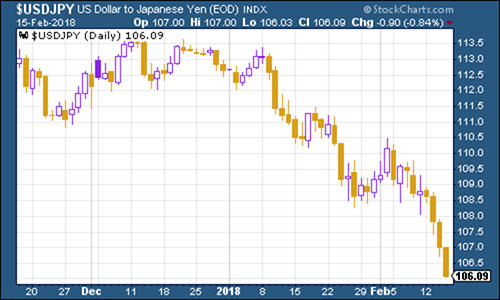
However, there's something else I want to draw attention to, which is a little unnerving the Japanese yen. The yen has continued to get stronger against the dollar (and in general) this week.
For perspective, here's the ten-year chart:
(Japanese yen vs US dollar: ten years)
And here it is over the last three months.
(Japanese yen vs US dollar: three months)
The thing is, a strengthening yen is typically a "risk off" sign. It's a sign that investors are getting worried and carry trades are unwinding (money borrowed in yen is returning to Japan).
Meanwhile, the Topix index has slipped back below the "iron coffin lid" level of 1,800.
What does it all mean?
I'm not sure. Maybe it's just the weak US dollar (higher deficits due to Donald Trump's tax cuts, and heavy selling of US Treasuries by foreign investors may well be behind that). Maybe it's the fact that the Japanese economy is putting in a solid performance and so money is increasingly being attracted back to the country (though that doesn't appear to be the case right now). And maybe it's just the fact that investors increasingly think that the Bank of Japan will be forced to raise interest rates, whereas they have largely priced in Fed moves by now.
But it's worth monitoring. Currencies are pressure valves for the financial system, and they often flag up turning points in market psychology or the background environment. When they do things you don't necessarily expect, it's worth watching particularly as central banks and governments keep a close eye on them too.
Let's turn to the usual charts now...
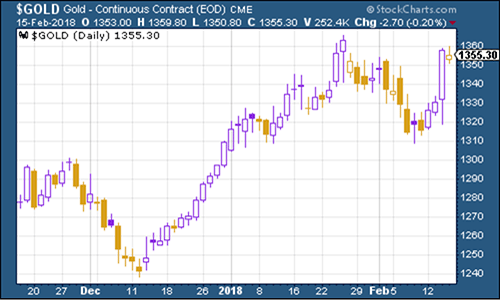
Gold enjoyed the news of rising inflation. As long as inflation increases outpace interest rate increases, then gold will be fine.
(Gold: three months)
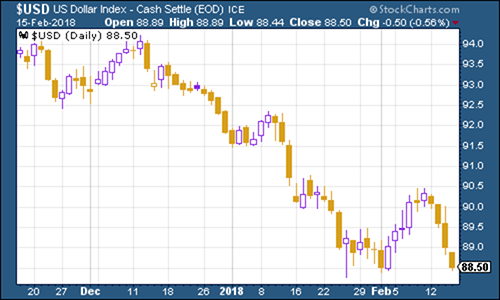
The US dollar index a measure of the strength of the dollar against a basket of the currencies of its major trading partners slid back this week, again likely a reaction to rising inflation expectations.
(DXY: three months)
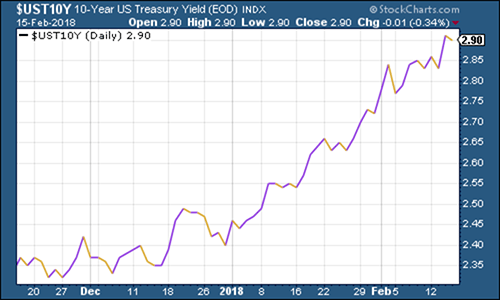
Meanwhile the yield on the ten-year US Treasury bond continued higher. Again, bonds don't like inflation, so no surprise here.
(Ten-year US Treasury: three months)
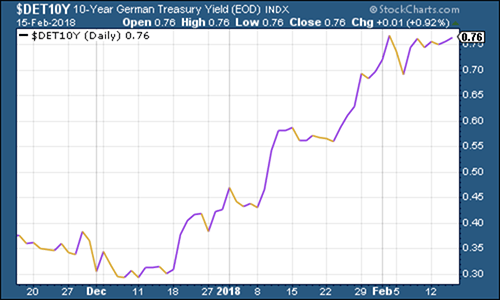
As for the ten-year German Bund the borrowing cost of Germany's government, which is Europe's "risk-free" rate it ticked higher though not as enthusiastically as its US equivalent.
(Ten-year bund yield: three months)
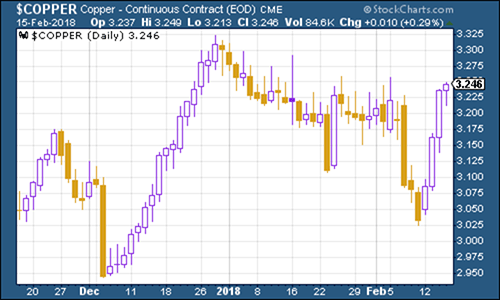
Copper rallied hard as last week's panic was shrugged off by broader markets. And if we really are in an inflationary environment, it should be good news for the red metal.
(Copper: three months)
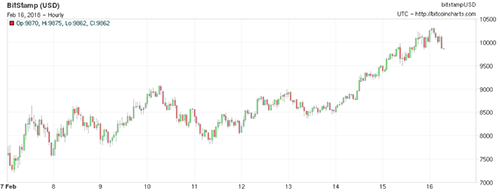
Bitcoin I'm finding really intriguing right now. It's rallied a lot. Whatever else you want to say about it, it's not dead in the water.
What I find intriguing about bitcoin is that I have no idea what it will do next. Obviously, I don't "know" what any asset will do next, but in a given set of circumstances, I can give you an idea of what an asset "should" do.
For example, if inflation rises more than the market expects, it's generally bad for bonds. If stock markets are falling, you often see "risk-off" behaviour across the board so maybe oil prices will fall too.
But for cryptocurrencies? No real rhyme or reason as far as I can see. Is it being seen as a "haven" asset? Or has it simply fallen to the point where enough people fancy a punt? I'm sure we'll figure it out one day.
(Bitcoin: ten days)
As for US employment the four-week moving average of weekly US jobless claims, rose to 228,500 this week, while weekly claims came in at 230,000. Claims have now been below the 300,000 level associated with a strong labour market, for the longest period since 1970.
According to David Rosenberg of Gluskin Sheff, when US jobless claims hit a "cyclical trough" (as measured by the four-week moving average), a stockmarket peak is not far behind (on average 14 weeks), and a recession follows about a year later. We hit a fresh cyclical trough last week, so who knows maybe the melt-up is yet to come
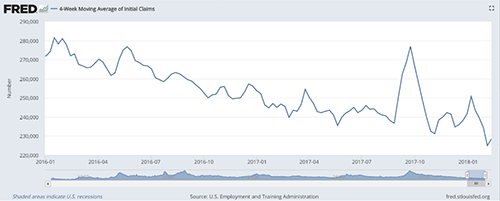
(Four-week moving average of US jobless claims: since start of 2016)
The oil price (as measured by Brent crude, the international/European benchmark) rebounded this week along with markets.
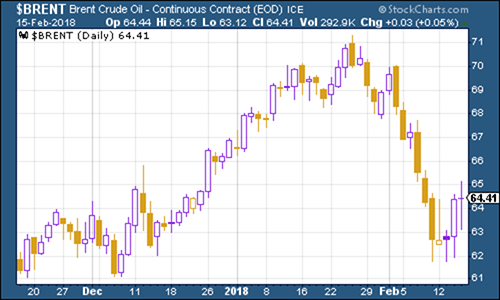
(Brent crude oil: three months)
It was a similar story for internet giant Amazon...
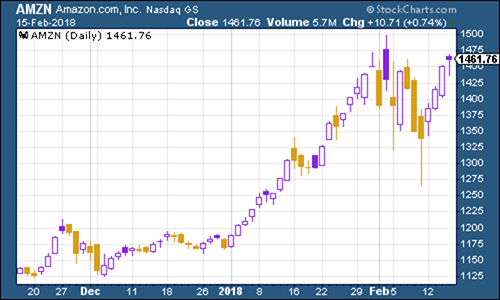
(Amazon: three months)
and for Tesla, both of which rallied with the wider markets.
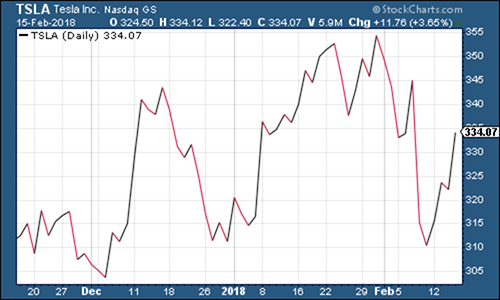
(Tesla: three months)
Get the latest financial news, insights and expert analysis from our award-winning MoneyWeek team, to help you understand what really matters when it comes to your finances.

-
 Average UK house price reaches £300,000 for first time, Halifax says
While the average house price has topped £300k, regional disparities still remain, Halifax finds.
-
 Barings Emerging Europe trust bounces back from Russia woes
Barings Emerging Europe trust has added the Middle East and Africa to its mandate, delivering a strong recovery, says Max King