Time to short American stocks
Stock markets in the US have enjoyed a long bull run. But as Matthew Partridge explains, it's time to take the other side of the bet.

You are now subscribed
Your newsletter sign-up was successful
Want to add more newsletters?

Twice daily
MoneyWeek
Get the latest financial news, insights and expert analysis from our award-winning MoneyWeek team, to help you understand what really matters when it comes to your finances.

Four times a week
Look After My Bills
Sign up to our free money-saving newsletter, filled with the latest news and expert advice to help you find the best tips and deals for managing your bills. Start saving today!

Up until now I've generally stayed away from betting on indices, with the exception of last year's trade on the CAC40 around the time of the French presidential election. This is because it's much easier to make a case for an individual company than the overall market. Still, I suspect that this month's tumble won't be the end of the market turbulence, especially in the US. The main problem is that the S&P 500 is hugely overvalued, both compared with other global markets and its own history.
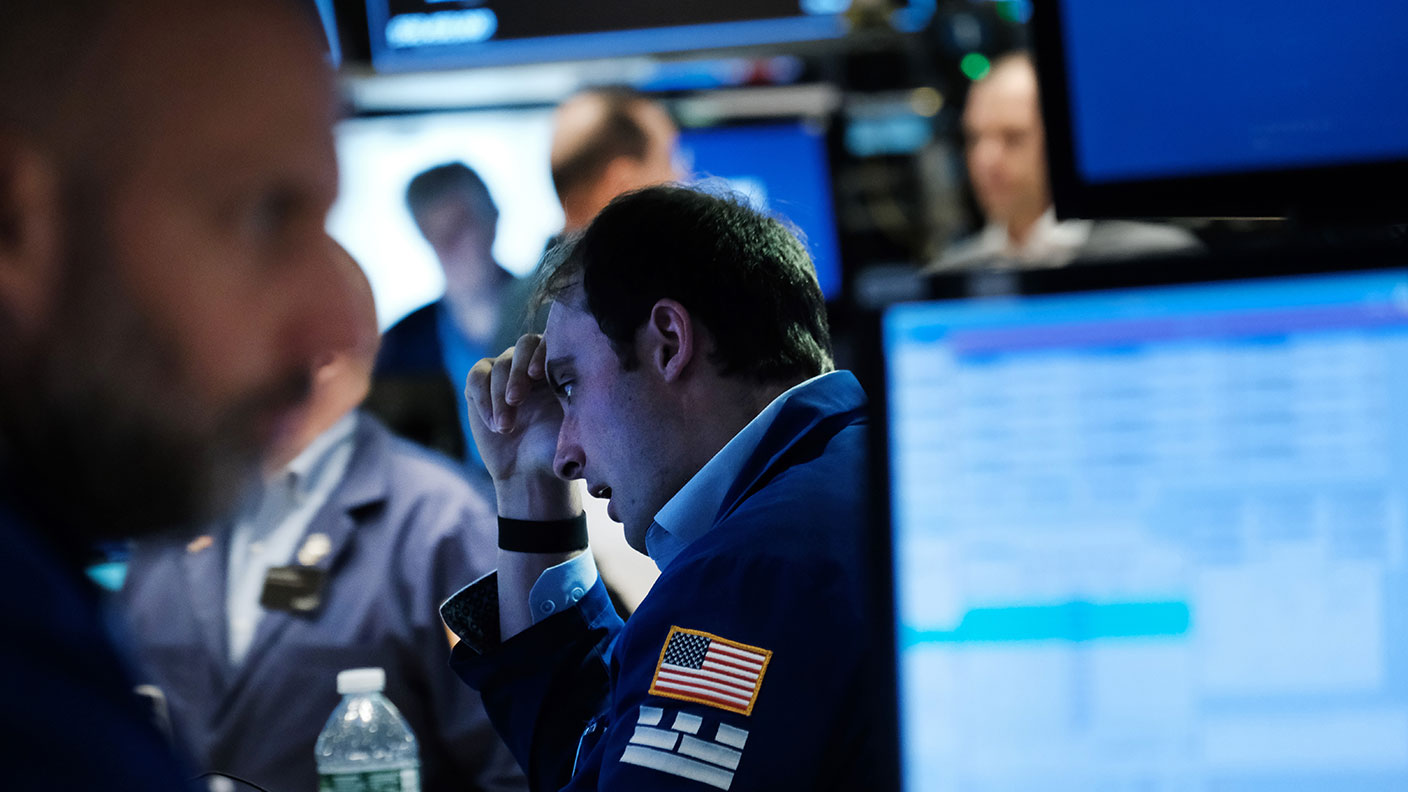
Investors are complacent
Investors seem to be being more than a little bit complacent and are assuming that the bull market which has been going on for nearly nine years will resume. Yet a strong reason to be bearish is that the Federal Reserve seems intent on raising interest rates. One of the big driving forces behind the bull market has been the perception that as soon as the market starts to decline, the Fed will step in.
MoneyWeek
Subscribe to MoneyWeek today and get your first six magazine issues absolutely FREE

Sign up to Money Morning
Don't miss the latest investment and personal finances news, market analysis, plus money-saving tips with our free twice-daily newsletter
Don't miss the latest investment and personal finances news, market analysis, plus money-saving tips with our free twice-daily newsletter
Yet the Fed seems pretty serious about restoring rates to more normal levels. This is good for the long-term health of the economy, but will force investors to reconsider valuations, exerting downward pressure on stocks. So it seems a good time to go short on the US market.
There are several options for doing this. For example, IG Index offers investors the choice of shorting the Dow Jones at £0.50 per point, the S&P 500 (which it calls the US 500) at £5 per point, or the Nasdaq (aka the Tech 1000) at £2 per point. The Dow Jones is a tricky index to short because it is made up of only 30 companies. By betting against the Nasdaq you're betting against some of the fastest-growing tech companies. So I suggest that you bet against the S&P 500 at 2,673 for £5 per point. I'd also suggest that you put in a stop-loss at 2,773, around the level of the 50-day moving average. This gives you a potential downside of £500.
Trading techniques: Bollinger bands
Momentum trading relies on buying shares that are doing well and selling those that are doing badly. However, some traders find it more profitable to adopt the opposite strategy ie, buying during moments of weakness, and selling during moments of strength, in the hope that these fluctuations will be temporary, and that prices will revert to more usual levels. Many of these traders find Bollinger bands a useful tool in deciding whether a share is overbought or oversold times at which it might make more sense to bet against the trend.
To produce Bollinger bands, take a chart with a simple 20-day moving average of a price and then draw two additional lines, each two standard deviations either side of the original line. The idea is that 95% of the time a share should trade in the area between the two lines. If a share's price approaches, or even breaks, the upper bound, a trader may consider going short. If the price hits the lower bound, they might consider going long. One point to note is that higher price volatility automatically increases the gap between the two bands.
Surveys indicate that Bollinger bands are one of the most popular strategies among short-term traders. A study by Jiali Fang and Yafeng Quinn of Massey University and Ben Jacobsen of TIAS business school found that following these signals helped traders to make money, especially when the technique was first discovered in the 1980s. However, in recent years they have lost most of their predictive power, especially since John Bollinger who developed the tool published a popular book on his strategy in 2001.
How my tips fared
In issue 800 (26 January) I made some major changes to the open positions that I have previously recommended. These included the decision to close my short positions in Tesla and Facebook, and to raise the stop-loss level on my long positions in IG, Petrobras and Renault. So how have these decisions worked out in light of recent market turmoil?
Candidly, the results have not been especially encouraging. The decision to close the shorts in Tesla and Facebook has proved to be particularly unfortunate in terms of timing, since the share prices of both tech firms have since fallen substantially. At the same time, four out of the five long positions have been hit by the dramatic fall in global stockmarkets.
While the trade on spread-betting provider IG Group is still making a relatively healthy profit of £449, the position in French carmaker Renault is now making only £168. Worse, property firm Hammerson is underwater to the tune of £204, while the trade in AA is losing a whopping £455. At 115p, shares in this car-repair service are now close to the stop-loss level of 96.5p.
The only silver lining is that Brazilian oil firm Petrobras has risen in price, so it is now £592.5 in profit. My suggestion that you short bitcoin has also been vindicated by the fact that the dollar price is now nearly $2,000 lower than it was at the end of January, which means that the short position is now a solid £493 in the black.
Overall, my open recommendations are making a total profit of £1,036. Set against a loss of £59 for all my closed positions, this gives a total gain of £977. The only change that I'm going to make is to close my recommendation on AA. Having held the position for six months and with a substantial dividend cut now looking very likely it's time to admit defeat on this particular trade, and move on. However, I'm happy to stick with Hammerson for the time being.

-
 MoneyWeek Talks: The funds to choose in 2026
Podcast Fidelity's Tom Stevenson reveals his top three funds for 2026 for your ISA or self-invested personal pension
-
 Three companies with deep economic moats to buy now
Opinion An economic moat can underpin a company's future returns. Here, Imran Sattar, portfolio manager at Edinburgh Investment Trust, selects three stocks to buy now


-
 As China reopens, why pick an income strategy?
Advertisement Feature Yoojeong Oh, Investment Manager, abrdn Asian Income Fund Limited
-
 The highest yielding S&P 500 Dividend Aristocrats
Tips Dividends are a key component of investment returns in the long-term. A portfolio of dividend aristocrats is a great way to build wealth and a sustainable income stream.
-
 2023 will be a bumper year for stocks. Here’s how to play the rally
Tips Dominic Frisby explains why he thinks the market rally could have further to run in 2023 despite macroeconomic headwinds
-
 A new dawn for Asian markets?
Advertisement Feature James Thom, Investment Manager, abrdn New Dawn Investment Trust plc
-
 Crash? What crash?
Sponsored October is often said to be a month of stockmarket crashes. But that's not true for this year, says Max King. A host of positive triggers are lining up for equities, says Max King.
-
 The US stock market – should you put more into the S&P 500?
Analysis Everything went right for the US stock market in the past decade. It will be hard to repeat that as interest rates rise. We look at how attractive the S&P 500 is right now.
-
 The end of cheap money hits the markets
News Markets have swooned as central banks raise interest rates, leaving the era of cheap money behind.
-
 The markets say sell, but should investors listen?
Analysis As fear grips markets around the world, investors need to have an honest conversation about what they’re comfortable with owning.


