What traders can learn from stock-market indexes
Several events are coming up with the potential to shake up markets. John C Burford finds out what that could mean for stocks.
Get the latest financial news, insights and expert analysis from our award-winning MoneyWeek team, to help you understand what really matters when it comes to your finances.
You are now subscribed
Your newsletter sign-up was successful
Want to add more newsletters?

Twice daily
MoneyWeek
Get the latest financial news, insights and expert analysis from our award-winning MoneyWeek team, to help you understand what really matters when it comes to your finances.

Four times a week
Look After My Bills
Sign up to our free money-saving newsletter, filled with the latest news and expert advice to help you find the best tips and deals for managing your bills. Start saving today!
This is an important week in the markets, make no mistake.
As we approach the end of September traditionally one of the weakest months for stock markets there are several events that are potentially market-changing.
Here are the highlights: today, Wednesday, the US Fed will issue its monthly statement of intent regarding its operations in the market. The Janet Yellen press conference afterwards will be dissected word by word by the usual pundits for hidden meanings
MoneyWeek
Subscribe to MoneyWeek today and get your first six magazine issues absolutely FREE

Sign up to Money Morning
Don't miss the latest investment and personal finances news, market analysis, plus money-saving tips with our free twice-daily newsletter
Don't miss the latest investment and personal finances news, market analysis, plus money-saving tips with our free twice-daily newsletter
Tomorrow, Scotland will vote on its in/out referendum, which has the potential (or near-certainty?) of ramping up market volatility from the depths of their current complacency.
And on Friday, the initial public offering (IPO) of Alibaba, which is the biggest IPO in history, will be launched in New York. The performance of the share price will speak volumes to the degree of risk the market is willing to assume.
So there are several inputs that have the potential to shake up many financial markets from stocks to gold to the US dollar to Treasuries.
Keep one eye on the markets
Today, I will focus on stock markets, which I haven't covered for some time.
This is because they have been consolidating their stunning gains over the past few months, although with large divergences between some major indexes and this is a major feature to be noted by traders.
The Scottish referendum is highly significant, because it demonstrates that even in a relatively stable political nation such asthe UK, cracks of division are opening up. Whichever side wins, the momentum now is for greater demand in the UK (and around the world) for self-determination. Small is becoming beautiful once more.
This implies social mood is becoming more negative (dissatisfaction with the status quo) a fitting backdrop to a major bear market in stocks.
Incidentally, most pundits are saying that if Scotland votes Yes (to separation), it will depress public sentiment. That is putting the cart before the horse as they always do. It is social mood that gives us the election results! And social mood is internally-generated. Outside events can only modify the existing moods, not generate them.
For traders, the big question is this: has the bear market in stocks already started? Because if it has, prudence suggests retreating from equity investments and for traders, positioning short in anticipation of a very large decline.
This month, US markets have shown distinct bi-polar behaviour. The senior index, the Dow Jones Industrials, has maintained its strength, but the more speculative indexes, the Nasdaq (tech-heavy) and Russell 2,000 (small-caps), have declined.
These are the dates of the all-time intra-day highs:
7 March Russell 2,000
3 September Nasdaq, S&P 500
4 September Dow Jones Industrial Average
Since the Russell 2,000 is made up of small-cap shares, it is considered the riskiest on the board, while the Dow consists of the 30highest-cap equities. In terms of risk, these are polar opposites.
When the Russell out-performs the Dow, it is risk-on, and vice versa.
Note that since March, when the Russell made its all-time high, it has been under-performing the Dow, which indicates that risk has been reducing for six months.
This subtle shift has been missed by many pundits, who have been cheerleading the new highs in the other indexes this summer.
Stock index overview
Because we are at this critical juncture, when stocks traditionally turn down this month, I thought I would review the position of the various US indexes.
Dow
Here is the daily chart stretching back to the major 2011 lows:
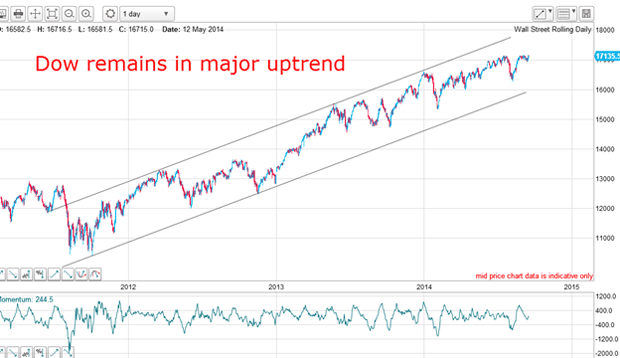
My tramlines, which I have shown before, are excellent.
I have a superb prior pivot point (PPP) on the upper line which has at least three accurate touch points. The parallel lower tramline takes in the two major lows. The market is trading in the upper half of the trading channel.
But what does the shorter time frame chart tell us?
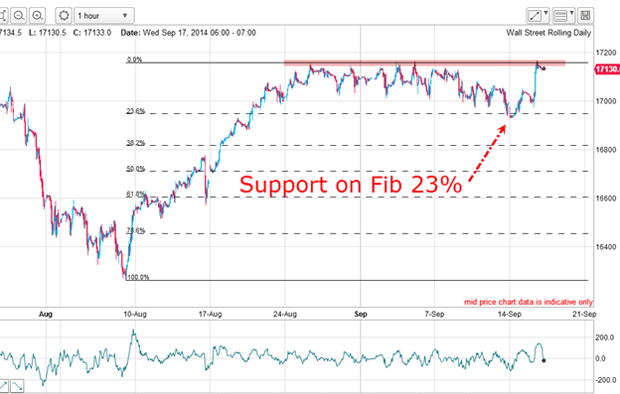
Since 24 August, the market has hit a ceiling in the 17,150 area (pink bar). The bears have tried to move the market lower, but it only made the shallow Fibonacci 23% support level before turning back up yesterday. This occurred on the back of the surprise' move by Chinese authorities to add stimulus to their economy.
Recent data out of China has indicated a severe slow-down in economic activity there, which is being accompanied by a real estate crisis.
Evidently, investors in US shares took that as a massive new Chinese quantitative easing (QE)operation, and when they heard the magic 'QE' word, they put two and two together and came up with buy shares'.
Also, note the character of the decline to the 23% support it has a zig-zag form with highly overlapping waves. This is typical of a correction, not a new major downtrend.
It appears if the market can push up above the pink resistance area, the way should be clear for a run at the 17,200 area (and possibly above). There should be many buy-stops in this area placed there by hopeful bears (the commitment of traders (COT) data shows roughly equal longs and shorts held by the speculators).
Nasdaq
Here is the daily chart:
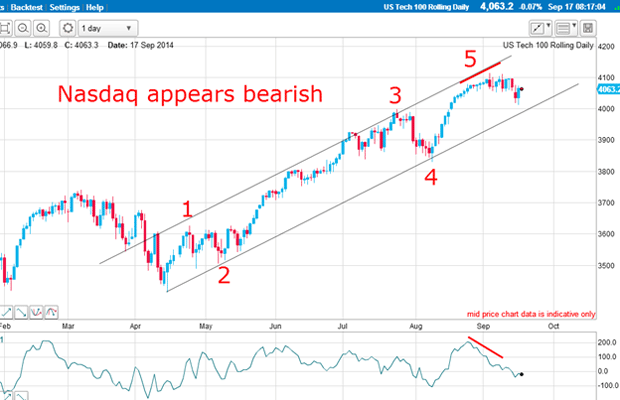
From the major April low, I have an excellent tramline pair with the upper line sporting an excellent PPP and multiple touch points.
The lower line has three accurate touch points. This is a very reliable tramline pair to work with. A break of the lower line should be a very significant event.
If my Elliott wave labels are correct, the next turn should be down.
Already, this chart is looking a lot more bearish than the Dow and is one of the huge divergences that are appearing in the indexes. This is one of the signs of a fractured market and this often spells an imminent reversal.
Let's look at the hourly:
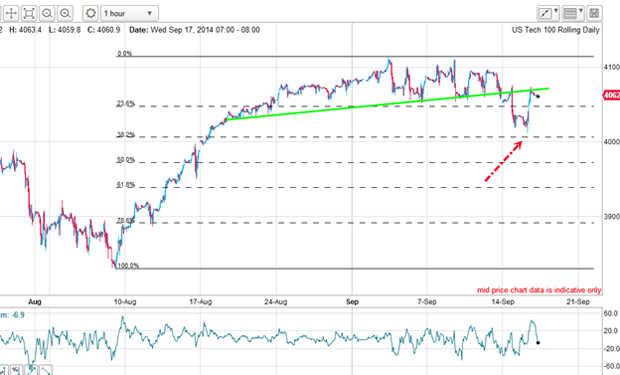
The first thing to note is the recent decline took the market to almost the Fibonacci 38% level (red arrow) a deeper decline than in the Dow. That is consistent with the risk-off theme that has been operating since March.
I have drawn the green line as a line of support/resistance. With its break a few days ago, the line is now resistance and becomes a possible turning point against further advances.
S&P 500
This index is a half-way house between the Dow and the Nasdaq/Russell 2000 in terms of perceived risk. Here is an intriguing set of tramlines I have been able to find on the hourly:
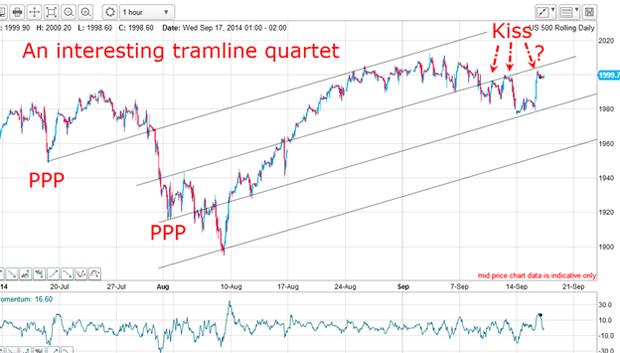
I started from the upper PPP and drew my first tramline across the 24 August highs.
Then, I adjusted my parallel line until I could capture the possible kisses. That set the separation of the tramlines. My third tramline gratifyingly took in its own superb PPP and the accurate touch point of Monday's low. Isn't that pretty?
This means that if the third kiss is to hold, the path of least resistance is down.
So, now I have in the short term, a bullish Dow picture, a not-so-bullish Nasdaq and now a quite bearish S&P.
That is an even more fractured stock market!
Russell 2,000
This is the small-cap index and is trading considerably weaker than the others. Here is the daily chart:
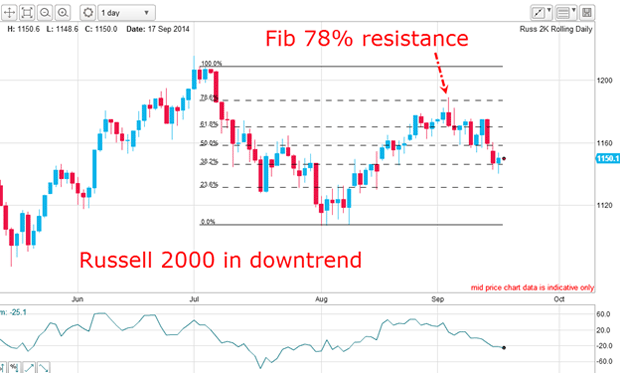
The July high was followed by an A-B-C (corrective) down. The August rally was considerably weaker than in the other indexes and only made it to the Fibonacci 78% retrace and not to a new high as did the others.
Now the market is falling again, but so far only in a three wave form, so I cannot say the downtrend is firmly established. I need to see a small-scale five-wave impulsive pattern before I can claim that.
FTSE 100
The UK index has been going nowhere for months:
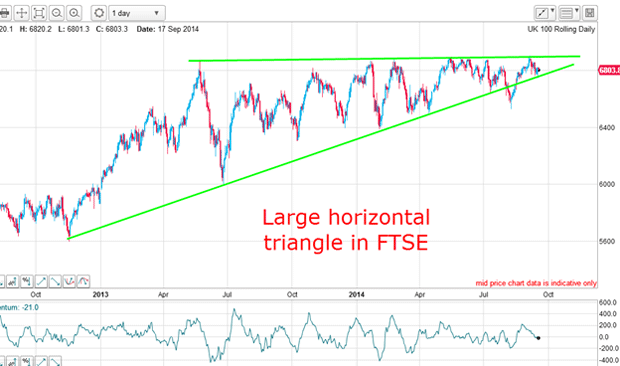
Since May 2013 over 15months ago the FTSE has made zero progress (compare the US indexes) and has formed a beautiful horizontal triangle. Note the nasty head fake break of the lower line in early August. That got me excited at the time!
One of the features of this pattern is that if the market can break upwards, the thrust is usually quickly retraced. And if it breaks to the downside, the move is usually very sharp as the mountain of sell-stops placed under the many lows are touched in a cascade of selling.
But trading this index has been very tough and that is why I have avoided it. The whipsaw action has been a classic widow-maker!
A major turn could be on the cards
The US stock indexes are displaying widening divergences, which is a feature of a fractured stock market.
After a huge bull run from the 2009 lows, the odds are very high that a major turn is near.
Get the latest financial news, insights and expert analysis from our award-winning MoneyWeek team, to help you understand what really matters when it comes to your finances.
John is is a British-born lapsed PhD physicist, who previously worked for Nasa on the Mars exploration team. He is a former commodity trading advisor with the US Commodities Futures Trading Commission, and worked in a boutique futures house in California in the 1980s.
He was a partner in one of the first futures newsletter advisory services, based in Washington DC, specialising in pork bellies and currencies. John is primarily a chart-reading trader, having cut his trading teeth in the days before PCs.
As well as his work in the financial world, he has launched, run and sold several 'real' businesses producing 'real' products.
-
 Average UK house price reaches £300,000 for first time, Halifax says
While the average house price has topped £300k, regional disparities still remain, Halifax finds.
-
 Barings Emerging Europe trust bounces back from Russia woes
Barings Emerging Europe trust has added the Middle East and Africa to its mandate, delivering a strong recovery, says Max King