You are now subscribed
Your newsletter sign-up was successful
Want to add more newsletters?

Twice daily
MoneyWeek
Get the latest financial news, insights and expert analysis from our award-winning MoneyWeek team, to help you understand what really matters when it comes to your finances.

Four times a week
Look After My Bills
Sign up to our free money-saving newsletter, filled with the latest news and expert advice to help you find the best tips and deals for managing your bills. Start saving today!
I last covered the euro on July 24 when the market had entered an indecisive phase. However, that hasn't stopped me finding a good swing trade and today I will explain how I did it.
I had expected a rather more volatile period of trading this summer, so I stayed mainly on the sidelines. But why had I correctly anticipated this volatility and become cautious?
MoneyWeek
Subscribe to MoneyWeek today and get your first six magazine issues absolutely FREE

Sign up to Money Morning
Don't miss the latest investment and personal finances news, market analysis, plus money-saving tips with our free twice-daily newsletter
Don't miss the latest investment and personal finances news, market analysis, plus money-saving tips with our free twice-daily newsletter
I generally avoid trading in fourth waves, but I did make an exception here, as I will show.
There is nothing more frustrating for a swing trader than to take a promising position and then see it whip back to stop the trade out, as so often happens in fourth waves. I was determined to avoid that fate, having been a victim earlier in my career and had learned that particular lesson.
Below is the daily chart I posted back then. I had drawn a convincing wedge with the lower wedge line break and kiss and a decline to the lower line. A bounce off that line was in progress. But I was content to just watch and see what pattern the market would trace out.
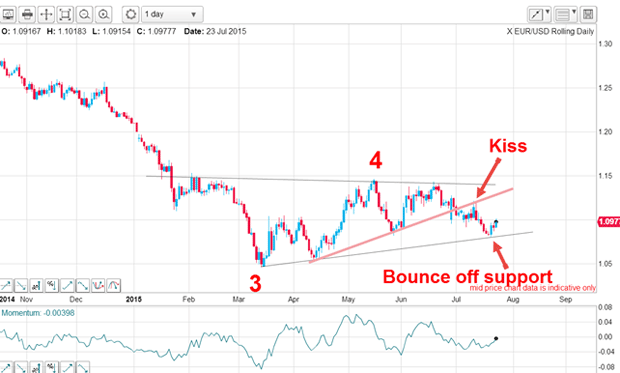
I have learned the hard way that only when a pattern becomes clear do I have the rationale for a trade. Otherwise, it is far safer to conserve my capital. I would rather miss a trade than risk capital in an iffy one. Getting as many ducks in a row as possible is my main task.
Here's how I made 150 pips in one day
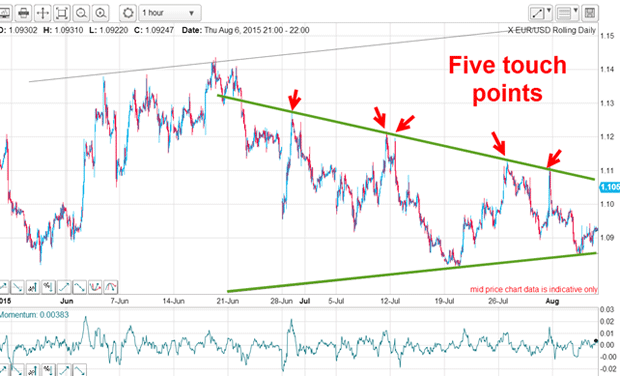
A spike high is a sign that the market did not want to spend much time at those levels because the selling pressure was too intense. And when several spike highs are found on a straight line, that line represents very strong resistance. Normally, you would conclude that when the market approaches that line again, it would be rebuffed.
But if buying pressure can somehow overcome that resistance, the move above the line would be sharp. That is because there will be many protective buy-stops placed just above the line by shorts who are confident they have judged the line of resistance as being as solid as a rock. It really does stand out even to the least experienced technical trader.
The below chart shows what happened to that line of resistance. It gave way and offered a great long trade entry (according to my tramline rule) at the 1.1050 area where a close protective stop could be employed.
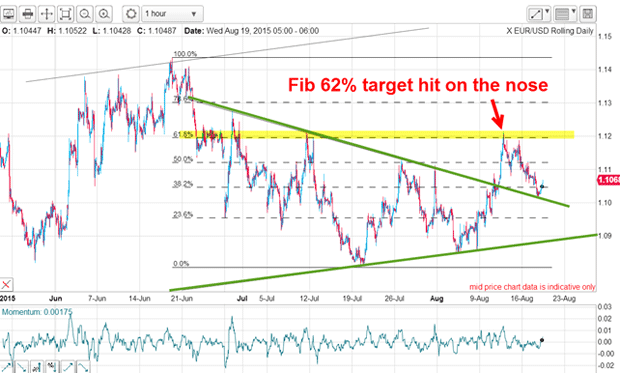
With that wedge line break, I needed a target where profits could be taken. And what better guide than the Fibonacci levels? Seeing as the 62% level is the most common place where a turn occurs, I set my target at 1.12.
And because we were still in the fourth wave, I was not going to hang on to this trade too long if it hit my target simply because we were still subject to sudden spike reversals.
Gratifyingly, my target was hit later on 12 August with a market making a high of 1.1213. That produced a tidy gain of 150 pips and within one day.
Don't worry about the news you can profit from the euro
It has also declined to the Fibonacci 50% retrace of the latest rally leg off the 1.0950 low. Therefore, the odds favour a resumption of the up-trend.
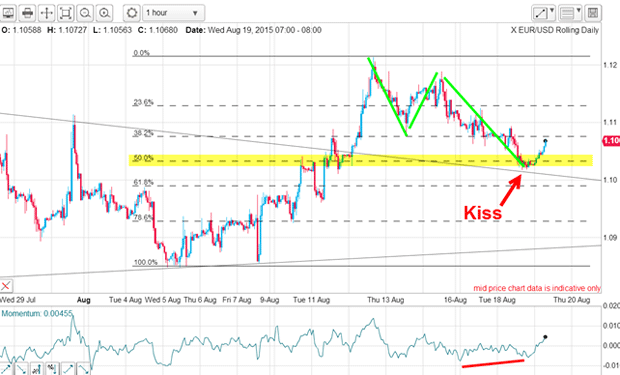
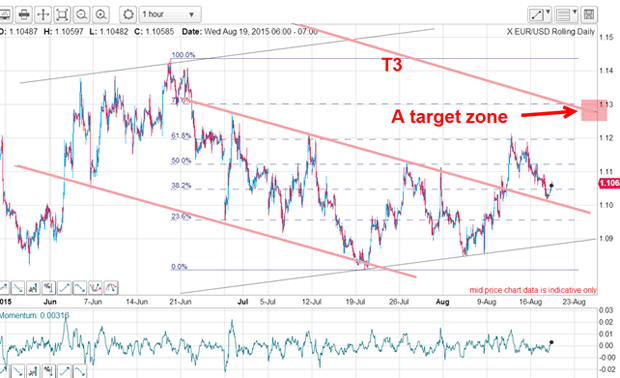
The best entry was of course at the kiss where a close protective stop could again be used. So what would be a plausible target? I have drawn in my tramlines (pink) and if the kiss holds, the main target area is at T3 which is in the 1.13 area. But if the kiss is a fake, then the market will decline back below my centre tramline and take me out for a small loss. I am ready for either event.
Finally, note that I have not referred once to the political or economic news in order to extract a profit from the euro market.
-
 MoneyWeek Talks: The funds to choose in 2026
Podcast Fidelity's Tom Stevenson reveals his top three funds for 2026 for your ISA or self-invested personal pension
-
 Three companies with deep economic moats to buy now
Opinion An economic moat can underpin a company's future returns. Here, Imran Sattar, portfolio manager at Edinburgh Investment Trust, selects three stocks to buy now

