The euro’s on the move – but how far will it go?
The euro is at an interesting juncture in the charts. John C Burford plots his next profitable foray into the market.
Get the latest financial news, insights and expert analysis from our award-winning MoneyWeek team, to help you understand what really matters when it comes to your finances.
You are now subscribed
Your newsletter sign-up was successful
Want to add more newsletters?

Twice daily
MoneyWeek
Get the latest financial news, insights and expert analysis from our award-winning MoneyWeek team, to help you understand what really matters when it comes to your finances.

Four times a week
Look After My Bills
Sign up to our free money-saving newsletter, filled with the latest news and expert advice to help you find the best tips and deals for managing your bills. Start saving today!
The situation in Greece has settled down in recent days and it has virtually vanished from the front pages (until the next crisis, that is). Under the surface, the euro has been churning and that has made it off-limits to me for new trades until now. Now the euro is at an interesting juncture.
On 15 July, I noted the market was in a kind of no-man's-land and between two important lines of support and resistance. This was the daily chart I had then:
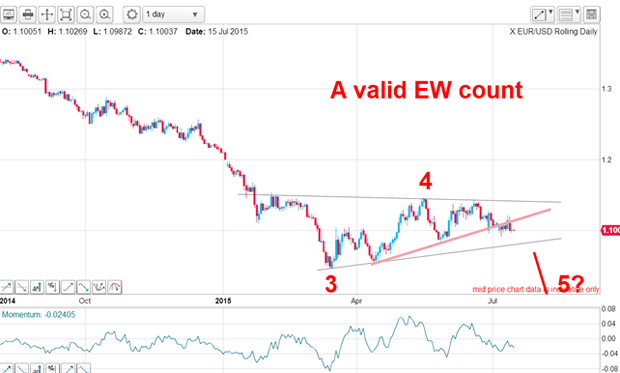
My tentative Elliott wave count suggested we were likely in a wave 5 down. But fourth waves can be exceedingly tricky and devious. Many traders are whipsawed to death by the zig-zag nature of fourth-wave trading. That is why I favour trading third waves they are much more reliable and profitable.
MoneyWeek
Subscribe to MoneyWeek today and get your first six magazine issues absolutely FREE

Sign up to Money Morning
Don't miss the latest investment and personal finances news, market analysis, plus money-saving tips with our free twice-daily newsletter
Don't miss the latest investment and personal finances news, market analysis, plus money-saving tips with our free twice-daily newsletter
I wasn't entirely sure that the market would not make a new high in wave 4. The short-term wave count was very fuzzy. But my line in the sand was the lower wedge line. Breaking hard below that would give me much greater confidence in my labels.
The market did break the lower wedge line and was heading for the lower line that I had drawn off the March and April lows. If the market declined to that line, it would encounter good support.
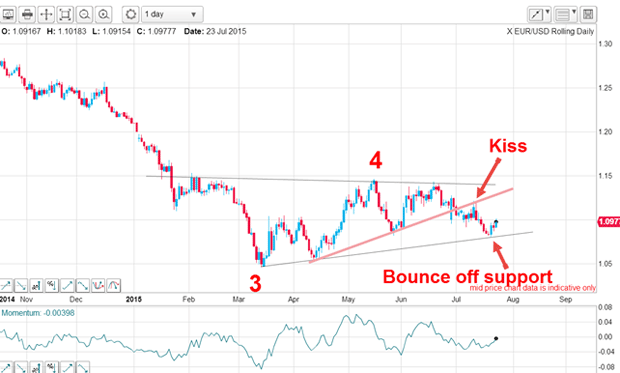
In fact, the market did decline following the break of the lower wedge line and proceeded to bounce up off it to plant a kiss on the underside of that line. That is pure textbook and that kiss helped cement the pink wedge line as a solid line of support/resistance.
I was able to forecast that bounce days in advance. I had simply relied on the fact that by extending the line between the two major lows in March and April, I had a line of support which would reverse the market when it did hit it. That simple exercise is an invaluable tool to have in a trader's kitbag.
Where will the euro go after this wedge?
But are there any clues as to the likely direction out of the current range? On the hourly the bounce up from the lower wedge line has a clear A-B-C form (green lines) with a negative-momentum divergence. Also, the rally has carried to the Fibonacci 50% retrace of the previous wave down.
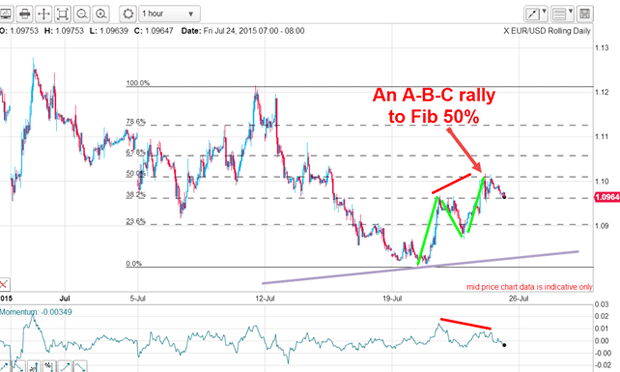
That is good evidence that the rally has likely completed and a re-test of the lower wedge line may well be on the cards. Remember, a three-wave move is almost always counter-trend.
But there remains another possibility and that is for a further rally up to the Fibonacci 62% level in an extension of the C wave. I have drawn in a possible tramline pair with the lower tramline only having one touch point, but it does have a good PPP (prior pivot point). My upper tramline has touch points as the major highs. If the market can rally from here, it would be heading for the crossing of the Fibonacci 62% and this upper tramline a significant area of resistance.
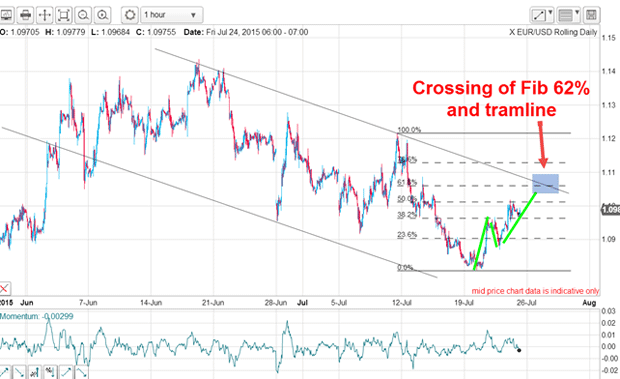
The rally off Tuesday's low would still have the required A-B-C form to retain its counter-trend character.
Taking a chance on Fibonacci levels
Sadly, there is no hard-and-fast rule here you just have to pay your money and take your chances!
I prefer to trade at the 50% level and enter a close stop. If I am stopped out, then I take a small loss and wait for the market to (hopefully) rise to the 62% level and trade again there.
That way, I do not miss a possible big move by waiting for an event that might not happen. I would have wasted all the effort in researching the trade and I hate wasted effort!
Finally, there is one thing traders need to keep in mind at all times what is the main trend? If it is down (as it is in EUR/USD), then most of the time the way to trade is to be short. That is trading with the trend a basic rule that is worth heeding.
Get the latest financial news, insights and expert analysis from our award-winning MoneyWeek team, to help you understand what really matters when it comes to your finances.
John is is a British-born lapsed PhD physicist, who previously worked for Nasa on the Mars exploration team. He is a former commodity trading advisor with the US Commodities Futures Trading Commission, and worked in a boutique futures house in California in the 1980s.
He was a partner in one of the first futures newsletter advisory services, based in Washington DC, specialising in pork bellies and currencies. John is primarily a chart-reading trader, having cut his trading teeth in the days before PCs.
As well as his work in the financial world, he has launched, run and sold several 'real' businesses producing 'real' products.
-
 Average income tax by area: The parts of the UK paying the most tax mapped
The UK’s total income tax bill was £240.7 billion 2022/23, but the tax burden is not spread equally around the country. We look at the towns and boroughs that have the highest average income tax bill.
-
 BBC TV licence fee hike confirmed: can you reduce how much you pay?
The cost of a TV licence fee is set to rise by over 3%, but there are ways to reduce the bill.