More kisses – this time from the Dow
Tramline kisses are a crucial clue that can tell you where the market is heading to next, says John C Burford.
Get the latest financial news, insights and expert analysis from our award-winning MoneyWeek team, to help you understand what really matters when it comes to your finances.
You are now subscribed
Your newsletter sign-up was successful
Want to add more newsletters?

Twice daily
MoneyWeek
Get the latest financial news, insights and expert analysis from our award-winning MoneyWeek team, to help you understand what really matters when it comes to your finances.

Four times a week
Look After My Bills
Sign up to our free money-saving newsletter, filled with the latest news and expert advice to help you find the best tips and deals for managing your bills. Start saving today!
In my final Trader post, I thought I would have a little fun with the Dow as a farewell offering.
It is my contention that it is far better to have a mediocre trading system using a tight set of money management rules than it is to use the latest gee-whiz system with a loose set of money management rules.
That is why I have emphasised that control of risk is far more important than any method you may use to research your trades.
MoneyWeek
Subscribe to MoneyWeek today and get your first six magazine issues absolutely FREE

Sign up to Money Morning
Don't miss the latest investment and personal finances news, market analysis, plus money-saving tips with our free twice-daily newsletter
Don't miss the latest investment and personal finances news, market analysis, plus money-saving tips with our free twice-daily newsletter
Today, most spread betting firms are upgrading their platforms to incorporate every possible bell and whistle to accommodate traders who wish to micro-manage their system. Naturally, I am not a great fan.
I believe in keeping things as simple as possible. When you do, you can keep your mind clear of clutter. Clear thinking is essential when trading. Just because technology today can give you a vast range of indicators, doesn't mean you should use them.
That is why I use hourly and daily charts most of the time, and use only one oscillator momentum which is the very first technical tool ever invented. My other input is sentiment.
So today, I will illustrate in the Dow how I use my simple tramline methods to find high-probability/low-risk setups for swing trades. Remember, I wish to capture swings of several hundreds of points. I am not interested in scalping markets where a move of 20 pips is considered a huge move by some.
That means I can use protective stops of 40 80 points most of the time and more importantly, I can set resting limit or stop orders ahead of time, thereby allowing me to do other things such as walk the dog.
I have used the Dow extensively in my posts as a market that conforms very well to my tramline analysis (the S&P 500 is almost as good).
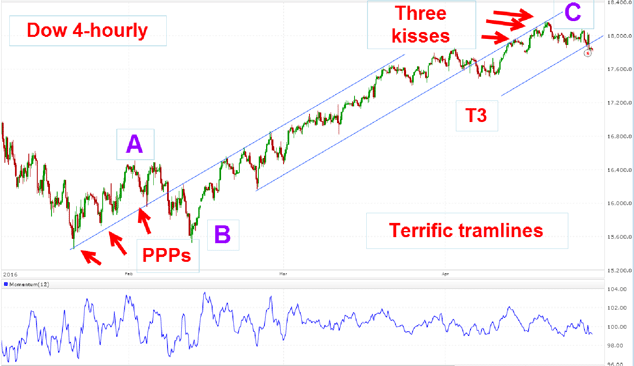
Here is the current chart showing the huge bull run up off the February lows.

Since February, I have considered the rally will be an A-B-C three up with the C wave turning into a five up. I have followed this rally and attempted to count the waves and just when I believed I had a fifth wave top, the market catches another bid and moves into new highs.
Naturally, this has been a somewhat frustrating period. I have caught one or two rallies with winning trades, but have always kept one eye on the exit door.
I have had the tramlines shown in place for some time, and then the centre tramline was broken early this month, I believed I had caught the start of the long-awaited turn down. But it was not to be and the market moved up to make new highs. And these highs made superb kisses on the underside of my tramline. That is a very important observation.
I have shown many examples of this tramline kissing behaviour in fact in last Friday's post I showed another triple kiss in EUR/USD.
Note the prior pivot points (PPPs) on the upper tramline a sure sign of its reliability as a line of resistance, especially with the multiple highly accurate touch points along its length. You should always look for potential tramlines that have at least one PPP and more than three accurate touch points.
It is important to understand what is happening in a kiss. Until the tramline break, the line acts as support. But now, the line acts as resistance and repels all attempts at breaking through. The nature of the market has changed. Rallies are now turned back whereas before, rallies were supported.
You may ask why are traders as a group now selling rallies and before they were buying them? Did word go round? Did they all react the same way to a piece of news? Did the bulls get tired of holding shares and saw another promising investment? Did the bears suddenly gird their loins and start shorting in droves?
We shall likely never know, but with the Daily Sentiment Index running well over 80% bulls recently, could there be much more firepower left at the disposal of the bulls?
Now with the sharp break yesterday, the market has hit T3 a normal place of support. I would expect a bounce of some kind here.
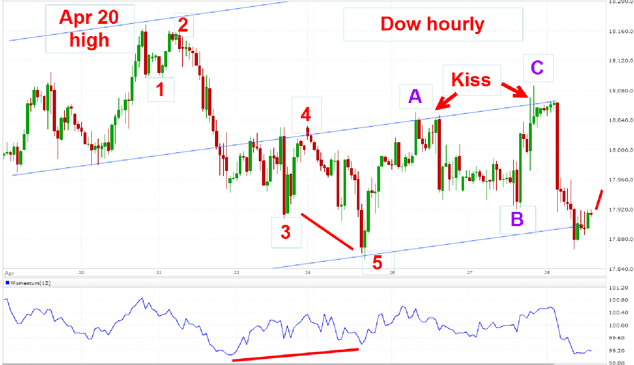
So, have we seen the high and has the decline resumed? Here is the chart I took yesterday morning:

I have a clear five down and that is the first thing I look for when I suspect a trend change. The relief rally is in a classic three up and note waves A and C tops were kisses on my tramline. Nice. I have a textbook five down/three up.
That cemented my bearish view and when the market bounced off the lower tramline, I could confidently forecast the market would resume its decline after this bounce.
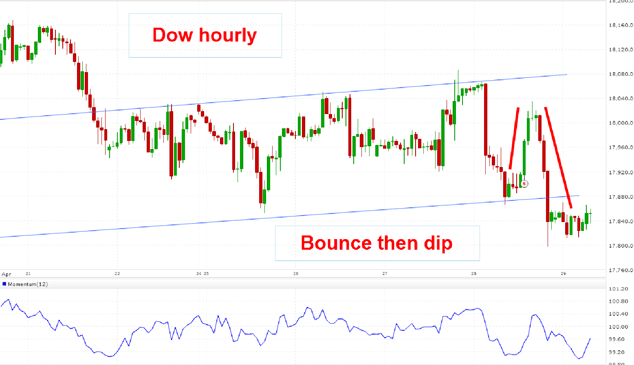
And this is the position this morning:

Following my bounce, the market was hit hard last night and moved below my tramline, which is currently being tested.
All along, there have been several good trade entries that offer low risk did you spot them?
Get the latest financial news, insights and expert analysis from our award-winning MoneyWeek team, to help you understand what really matters when it comes to your finances.
John is is a British-born lapsed PhD physicist, who previously worked for Nasa on the Mars exploration team. He is a former commodity trading advisor with the US Commodities Futures Trading Commission, and worked in a boutique futures house in California in the 1980s.
He was a partner in one of the first futures newsletter advisory services, based in Washington DC, specialising in pork bellies and currencies. John is primarily a chart-reading trader, having cut his trading teeth in the days before PCs.
As well as his work in the financial world, he has launched, run and sold several 'real' businesses producing 'real' products.
-
 Average UK house price reaches £300,000 for first time, Halifax says
While the average house price has topped £300k, regional disparities still remain, Halifax finds.
-
 Barings Emerging Europe trust bounces back from Russia woes
Barings Emerging Europe trust has added the Middle East and Africa to its mandate, delivering a strong recovery, says Max King