How I made a perfect trade in the S&P 500
Take a disciplined approach to your trading and follow your analysis to the letter, says John C Burford. Nobody can ask more than that.
Get the latest financial news, insights and expert analysis from our award-winning MoneyWeek team, to help you understand what really matters when it comes to your finances.
You are now subscribed
Your newsletter sign-up was successful
Want to add more newsletters?

Twice daily
MoneyWeek
Get the latest financial news, insights and expert analysis from our award-winning MoneyWeek team, to help you understand what really matters when it comes to your finances.

Four times a week
Look After My Bills
Sign up to our free money-saving newsletter, filled with the latest news and expert advice to help you find the best tips and deals for managing your bills. Start saving today!
The party ended on Friday.
How do I know this? Well, this is how the four most important measures of inflation moved that day:
Dow down nearly 300 points all-time high: 2 March.
MoneyWeek
Subscribe to MoneyWeek today and get your first six magazine issues absolutely FREE

Sign up to Money Morning
Don't miss the latest investment and personal finances news, market analysis, plus money-saving tips with our free twice-daily newsletter
Don't miss the latest investment and personal finances news, market analysis, plus money-saving tips with our free twice-daily newsletter
June Treasury Bonds down almost 400 points all-time low in ten-year yield: August 2012.
Gold down $30 or so all-time high: October 2011.
US dollar EUR/USD down 200 points or so all-time high in euro: 2008.
US Treasury bonds, gold and the dollar are already in multi-year bear markets. The only hold-out has been the Dow (and other stock indexes), which has been powering ahead blithely with little regard for the land mines it has been placing along the way.
So what do these different markets have in common? They have been pumped up by unprecedented levels of highly leveraged QE (quantitative easing) dollars that had no other home.
The simultaneous decline in all four of these markets means that the forces of deflation have taken over all major markets.
But why is deflation such a horrific nightmare for the markets? Surely a reduction in prices is good news?
I regard deflation as a reduction in the supply of money and credit. Consumer prices sometimes respond to these changes. Because there are gargantuan levels of debt in private and government hands, debt is now being acquired to sustain the existing debt and that is unsustainable.
With interest rates pinned to the floor, any hint of an increase will send shock waves of horror through the massed ranks of over-leveraged banks and hedge funds who have piled in to assets. Such a hint was given on Friday with the strong' US jobs report.
At last, a viable way to trade in volatile US equities
The Nasdaq is a bubble in search of a pin
I also mentioned that I had no intention to trade on that index: with new highs being made almost daily, my tramline methods were not appropriate.
Last week, though, that situation suddenly changed, and I now have some superb trading setups.
I will focus on the S&P 500 since that index is the most representative for US shares of all descriptions.
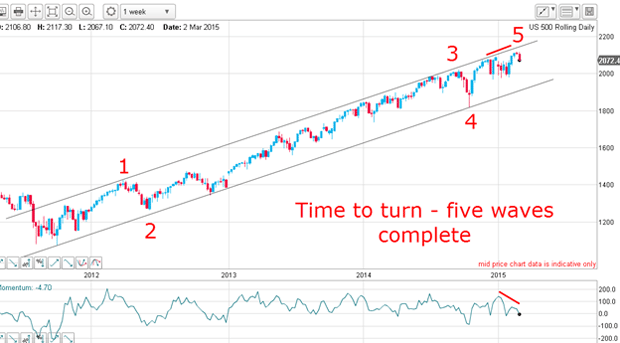
Here are my lovely tramlines on the weekly chart from the major low of 2011:

My Elliott waves are virtually textbook, and conform nicely to the trading channel between my tramlines. But the rally has failed to reach the upper tramline that means it's weakening.
Crucially, the large negative-momentum divergence at the recent highs (see red bar) indicates a severe drop in buying power into last week's highs. The smart money is getting out.
My Elliott waves gave me a position too good to ignore
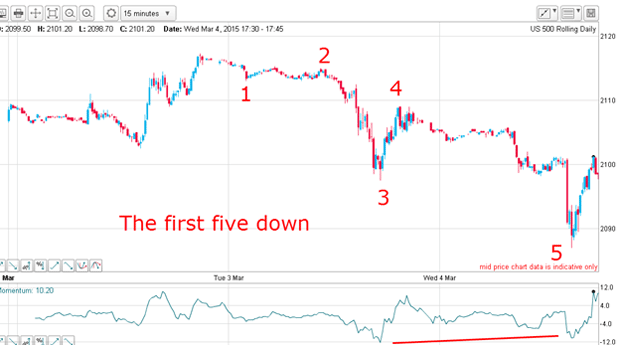
Indeed, from the 2 March high, I have a valid five down on the 15-minute not pretty, but it works and there is a positive-momentum divergence at the wave 5 low.

With this information, a swing trader can now start looking to short on a rally off the wave 5 low. As a practical matter, it is not advisable to jump in just when you have identified the five down pattern. Remember, timing is crucial.
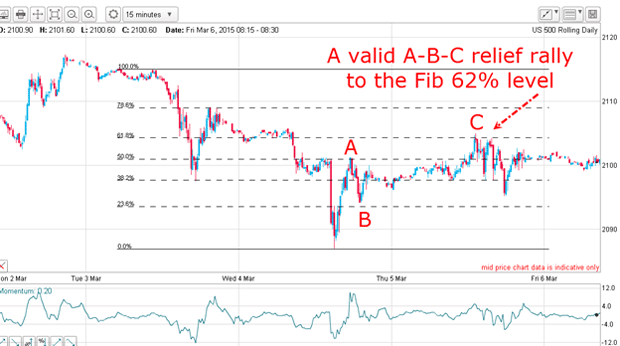
Here is the very best trading strategy: because the most common relief pattern following a five down is an A-B-C up, it is best to see if this pattern does trace out and to short the market near the C wave high, if it presents. And if the C wave reaches the Fibonacci 62% level, that is the absolute textbook place to enter shorts.
So let's see what happened after the five down:

Lo and behold here is the A-B-C rally with the C wave reaching the precise 62% level.
That was a gift that could not be ignored. This five down/up and three up/down is one of my favourite setups.
A short trade on Thursday near that level, protected with a close stop just beyond the 62% level, was the ideal position: you were making a high probability/low-risk trade there the swing trader's Holy Grail.
Even if the trade did not eventually work out, it was still a perfect trade. You had followed your disciplined analysis, had put on the trade at the right place and protected with a close stop. Nothing more could be asked it was a trade a true professional would be proud of.
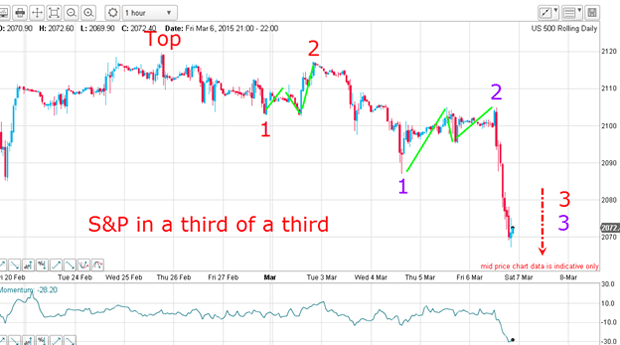
As it happens, the market began a steep slide on Friday and this is the result on the hourly:

I can apply my best guess Elliott waves to that sharp fall: I have a series of 1-2s with the second waves in the tell-tale corrective A-B-C form (green bars).
The implications are stark: the third of a third pattern is the most powerful in the book and the omens are clear. The only thing that could cancel out this forecast is for the market to rally above the purple wave 2 high.
I can start using my tramline methods to trade the stock indexes with some confidence.
Get the latest financial news, insights and expert analysis from our award-winning MoneyWeek team, to help you understand what really matters when it comes to your finances.
John is is a British-born lapsed PhD physicist, who previously worked for Nasa on the Mars exploration team. He is a former commodity trading advisor with the US Commodities Futures Trading Commission, and worked in a boutique futures house in California in the 1980s.
He was a partner in one of the first futures newsletter advisory services, based in Washington DC, specialising in pork bellies and currencies. John is primarily a chart-reading trader, having cut his trading teeth in the days before PCs.
As well as his work in the financial world, he has launched, run and sold several 'real' businesses producing 'real' products.
-
 ISA fund and trust picks for every type of investor – which could work for you?
Whether you’re an ISA investor seeking reliable returns, looking to add a bit more risk to your portfolio or are new to investing, MoneyWeek asked the experts for funds and investment trusts you could consider in 2026
-
 The most popular fund sectors of 2025 as investor outflows continue
It was another difficult year for fund inflows but there are signs that investors are returning to the financial markets