Nasdaq is a bubble in search of a pin
Stockmarkets are in bubble territory and the tech-heavy Nasdaq is leading the charge. John C Burford refers to the charts to explains why.
Get the latest financial news, insights and expert analysis from our award-winning MoneyWeek team, to help you understand what really matters when it comes to your finances.
You are now subscribed
Your newsletter sign-up was successful
Want to add more newsletters?

Twice daily
MoneyWeek
Get the latest financial news, insights and expert analysis from our award-winning MoneyWeek team, to help you understand what really matters when it comes to your finances.

Four times a week
Look After My Bills
Sign up to our free money-saving newsletter, filled with the latest news and expert advice to help you find the best tips and deals for managing your bills. Start saving today!
I have not covered stock markets of late, because, frankly, I had nothing new to say and no trades to show using my tramline methods. Since January, stock markets have been on a tear with new all-time highs being registered almost daily in some major indexes.
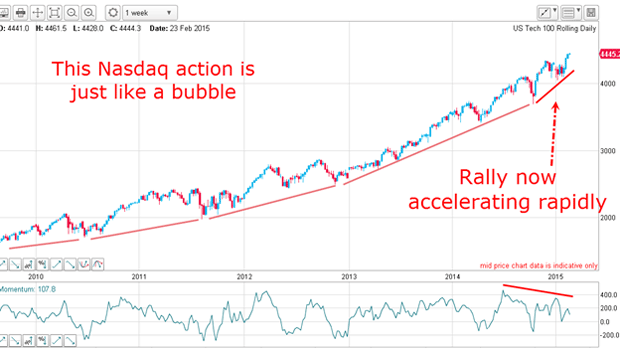
Today I want to review the background to this roaring bull market. I believe we are in bubble-like conditions and the bio- and tech-heavy Nasdaq is leading the charge.
The Nasdaq looks overwhelmingly bullish

Before 2013, there were sizeable counter-trend dips, a sure sign of a healthy market, the type of market that I can trade with my tramline methods.
MoneyWeek
Subscribe to MoneyWeek today and get your first six magazine issues absolutely FREE

Sign up to Money Morning
Don't miss the latest investment and personal finances news, market analysis, plus money-saving tips with our free twice-daily newsletter
Don't miss the latest investment and personal finances news, market analysis, plus money-saving tips with our free twice-daily newsletter
A healthy bull market is one with a major uptrend but with a large number of bears that sell into the rallies to produce healthy pull-backs (many of these pull-backs are turned at the Fibonacci levels, as I mention frequently). When the buying pressure finally takes over, the market can rally again, taking out the buy stops of the bears, and adding to the buying pressure.
The action of a healthy market is two-way; the situation today is all one-way.
Bears are scarce, and that means trouble
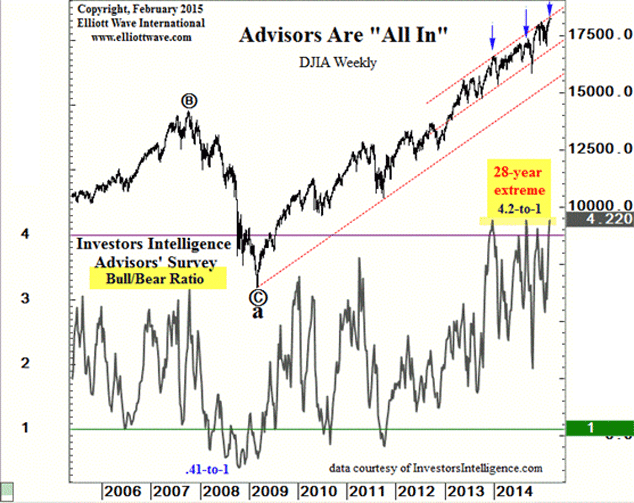
Right now, the bull/bear ratio is at a 28-year high (the 4.2 print was last seen just before Black Monday the famous Crash of 1987).

Chart courtesy www.elliottwave.com
Naturally, a 28-year high in the number of bullish advisors in the US stock market means a 28-year low in the number of bearish advisors. This very low bearishness has persisted on and off for about 18months long enough for a high degree of complacency to have set in.
The longer the bull market runs, and the steeper the gains, the more convinced the bulls become that stocks will never turn down. Success breeds success, does it not?
Well, not necessarily; this belief is called recency bias, and I believe that it's behind the exponential accelerating uptrend this year.
If this is unhealthy, what does a healthy market look like?
If there are only a few bears placing short bets, who will do the buying to smooth the declines when the market finally turns down? That's usually done by the bears as they cover (buy back) their profitable trades, but no bears means no smooth ride down.
That's what happened prior to Black Monday 1987; few traders were short and the market plunged off the cliff with few buyers in sight.
Today, with few bears brave enough to poke their heads above ground, the bulls are simply buying and selling from themselves just as in 1987. There's a high risk of history repeating itself.
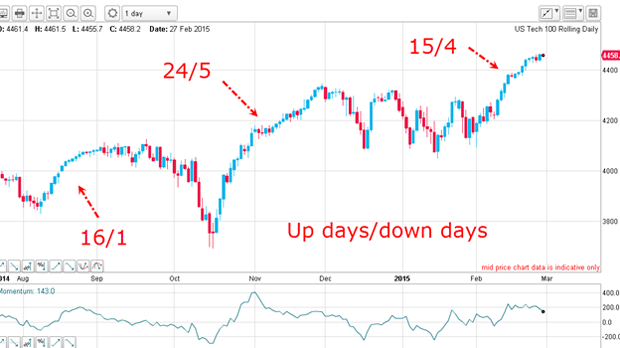
Something else is a little unusual in that Nasdaq chart the number of consecutive days with gains (blue) rather than losses (red).
Note the preponderance of blue days and the paucity of red days on the rallies since last August:

This week, the market is making another giant leap with many more blue than red days.
This action is typical of an investment mania AKAa bubble.
The great stock market recovery and boom since 2009 has been financed by the enormous increase in money supply engineered by the central banks. The money supply in the USA, Eurozone and Japan has accelerated even more sharply in Q4 2014, thus providing the fuel for the Nasdaq fire this quarter (see top chart).
Not only that, but banks and hedge funds can leverage their central bank loans by many multiples, thus providing even more buying power.
So how will this end? No doubt about it: it'll end badly (for the bulls).
JM Keynes famously said: "Markets can remain irrational longer than you can remain solvent". But the time to be short will arrive.
Get the latest financial news, insights and expert analysis from our award-winning MoneyWeek team, to help you understand what really matters when it comes to your finances.
John is is a British-born lapsed PhD physicist, who previously worked for Nasa on the Mars exploration team. He is a former commodity trading advisor with the US Commodities Futures Trading Commission, and worked in a boutique futures house in California in the 1980s.
He was a partner in one of the first futures newsletter advisory services, based in Washington DC, specialising in pork bellies and currencies. John is primarily a chart-reading trader, having cut his trading teeth in the days before PCs.
As well as his work in the financial world, he has launched, run and sold several 'real' businesses producing 'real' products.
-
 Average UK house price reaches £300,000 for first time, Halifax says
While the average house price has topped £300k, regional disparities still remain, Halifax finds.
-
 Barings Emerging Europe trust bounces back from Russia woes
Barings Emerging Europe trust has added the Middle East and Africa to its mandate, delivering a strong recovery, says Max King