You are now subscribed
Your newsletter sign-up was successful
Want to add more newsletters?

Twice daily
MoneyWeek
Get the latest financial news, insights and expert analysis from our award-winning MoneyWeek team, to help you understand what really matters when it comes to your finances.

Four times a week
Look After My Bills
Sign up to our free money-saving newsletter, filled with the latest news and expert advice to help you find the best tips and deals for managing your bills. Start saving today!
My last post on the euro was on 22 April ("Forget parity, I think we're about to see a big euro rally"); the EUR/USD was trading at the 1.0750 level and was challenging my upper tramline. This was the hourly chart I posted:
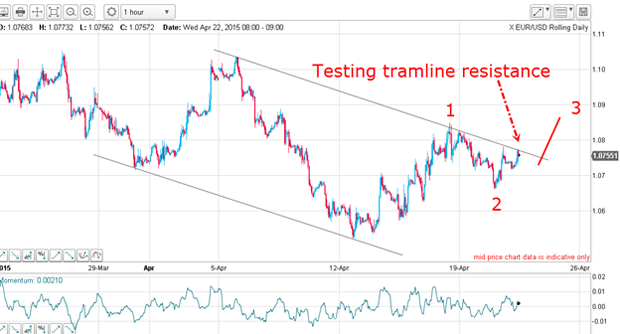
This question brings up an important principle in trading with tramlines. It is vitally important to understand the context which has brought the market to that point. In other words, what is the one larger trend? Because that will always take precedence over the short-term. This principle is well-illustrated here.
MoneyWeek
Subscribe to MoneyWeek today and get your first six magazine issues absolutely FREE

Sign up to Money Morning
Don't miss the latest investment and personal finances news, market analysis, plus money-saving tips with our free twice-daily newsletter
Don't miss the latest investment and personal finances news, market analysis, plus money-saving tips with our free twice-daily newsletter
Doom and gloom were everywhere, but I had faith in the euro
The commitments of traders (COT) data then showed hedge funds who are almost always on the wrong side of the market at major turns held a record bearish count net short euro futures.
By any logic, surely Greece would have to default in its massive debts? Germany was stiffly opposed to any concessions and payment deadlines loomed.
But if there was a problem, the market surely didn't believe it.
The whiff of fear of contagion was in the air last month. But as I outlined in posts at the time, the euro was never likely to reach parity if only because the gloom-and-doom sentiment was so widespread. By my reckoning, the politicians were never likely to be forced to abandon their baby they always had the printing press standing by ready for action.
That is why I believed the rally off the 13 April low of 1.0460 was very likely to be the start of a massive counter-trend move in the mother of all short squeezes.
Now, from the 1.0750 print on 22 April, the market has spiked up to above the 1.12 level a gain of 450 pips in a little over a week. That sharp move validates my forecast that the market is in the early stages of a third wave. The short squeeze is on!
Third waves are my very favourite setups. It is easy to see why from examining a close-up of the hourly chart. The market smashed through the centre tramline and even poked through T3 (note the little kiss back on that tramline). That's how powerful third waves can be they take no prisoners.
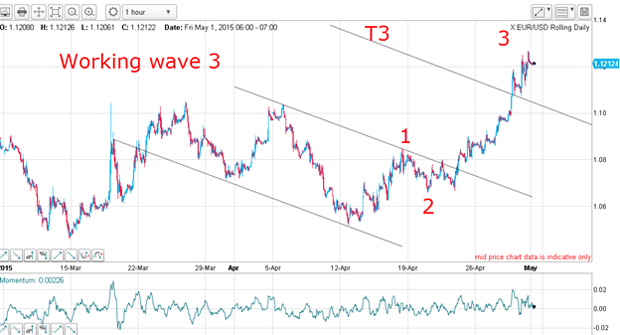
If you miss an early entry in a typical third wave, it is virtually impossible to jump on board with a low-risk trade. About the only policy available is to jump in and close your eyes! That is why I favour trying to get an early handle on the likely Elliott waves as I did on 22 April because then your trade can be protected with a close stop.
How does this move stack up against the bigger picture?
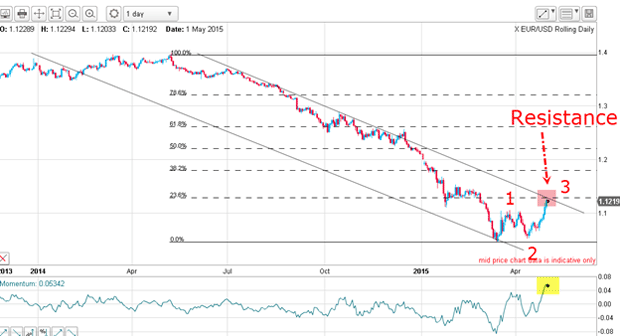
My conclusion is that the market, having hit major resistance, needs at least a breather here.
Short term traders will be looking at taking at least partial profits at around this level. If they had entered a long trade at the 1.06 area in mid-April, that would represent a tidy profit of over 600 pips. Nice.
Of course, the market may just power on above my upper tramline, but because this area is also overhead resistance from the congestion zone from January-February, that outcome is somewhat less likely.
So what strategy can we employ for handling this dilemma?
One way is to use a trailing stop a very popular method with long-term traders which we can use here.
I am able to draw a fine trendline on the recent rally with many accurate touch points. Breaking below that which is probable based on the weakening momentum picture would likely indicate a more protracted pull-back was in the offing. Placing a protect-profit sell stop in the pink zone would capture most of the profit available.
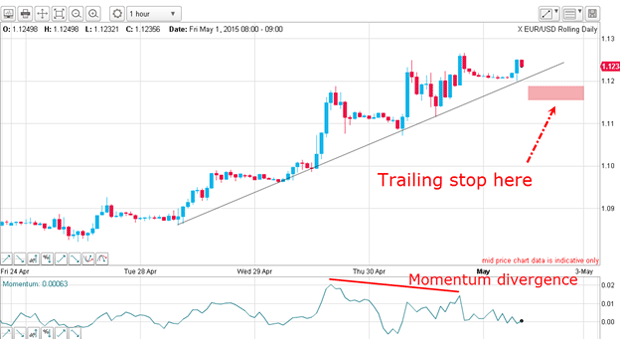
If the market decides to resume its rally without breaking the line, no worries! You can raise your sell stop as the market rises, sit back and enjoy your added gains.
-
 ISA fund and trust picks for every type of investor – which could work for you?
Whether you’re an ISA investor seeking reliable returns, looking to add a bit more risk to your portfolio or are new to investing, MoneyWeek asked the experts for funds and investment trusts you could consider in 2026
-
 The most popular fund sectors of 2025 as investor outflows continue
It was another difficult year for fund inflows but there are signs that investors are returning to the financial markets

