Forget parity, I think we’re about to see a euro big rally
Traders are on the lookout for a Greek exit and a plunging euro, says John C Burford. The stage is set for a turnaround.
Get the latest financial news, insights and expert analysis from our award-winning MoneyWeek team, to help you understand what really matters when it comes to your finances.
You are now subscribed
Your newsletter sign-up was successful
Want to add more newsletters?

Twice daily
MoneyWeek
Get the latest financial news, insights and expert analysis from our award-winning MoneyWeek team, to help you understand what really matters when it comes to your finances.

Four times a week
Look After My Bills
Sign up to our free money-saving newsletter, filled with the latest news and expert advice to help you find the best tips and deals for managing your bills. Start saving today!
I'm following up on the euro story today because it is currently offering a magnificent example of how to put my tramline methods into action.
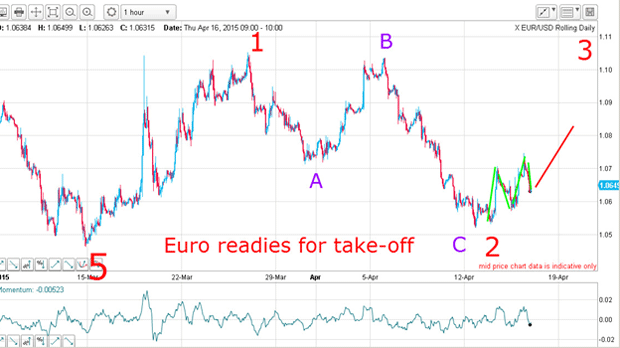
On Monday I described how I had stalked a long trade in EUR/USD at my C wave low (which dipped further than I had originally expected). My long entry was just below the 1.06 level and I had my protective stop 50 pips under that. As the market gathered strength, it traced out what I call a rising five wave zig zag. This is an interesting pattern that I have noted in similar situations.

The market makes a new high, then suffers a sharp fall. It rallies above the previous high, dips again but not below the previous low and then pushes above the previous highs. On Monday, this latter move was hopefully up ahead. I have marked the waves of the zig zag in green, and my projection in red.
MoneyWeek
Subscribe to MoneyWeek today and get your first six magazine issues absolutely FREE

Sign up to Money Morning
Don't miss the latest investment and personal finances news, market analysis, plus money-saving tips with our free twice-daily newsletter
Don't miss the latest investment and personal finances news, market analysis, plus money-saving tips with our free twice-daily newsletter
Now, this zig zag is not to be confused with the Elliott wave five wave motive pattern that I frequently describe in these posts.
This zig zag is a continuation pattern and the key feature is that the Monday low should not dip below the previous low of the pattern. If it did, that would turn the zig zag into an A-B-C corrective pattern which would herald new lows, not a rally phase.
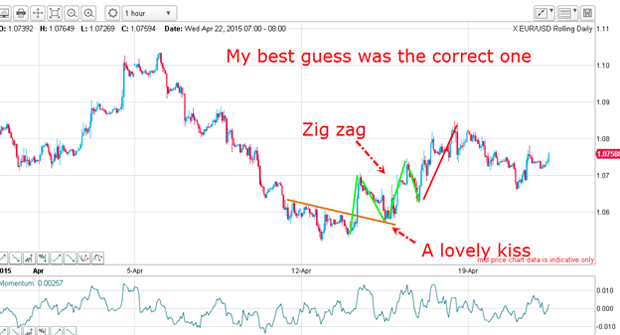
On my Monday chart, I drew in my forecasted move up out of the pattern in red. That was my best guess as to the immediate move. Of course, I did not have certainty that this would occur! So how did my forecast work out?
Following the lovely kiss on my minor trendline, the market entered the zig zag and came out of it with a flourish up the 1.0850 area, which was an exact hit on the Fibonacci 62% retrace of the big C wave down.

This was an area where short-term profits were available, as I outlined on Monday.
Longer term position traders would continue to hold their long trades taken just under the 1.06 area, of course.
Following that hit on the 62% retrace, the market did the expected and declined off that powerful resistance. The question on Friday was how deep the decline would be. Of course, there was no guarantee that the decline I had projected would not turn out to be a whopper, taking the market down into new lows.
After all, the news out of Greece appeared dire the headlines that proclaimed the end game for bond defaults were getting louder with payment deadlines looming large.
Of course, most of the time, the market discounts the most extreme disaster scenarios and so it appears with the euro.
So the question is: where will the dip end and the rally resume? This is where my tramline method comes into its own.
All my tramlines are suggesting a rally

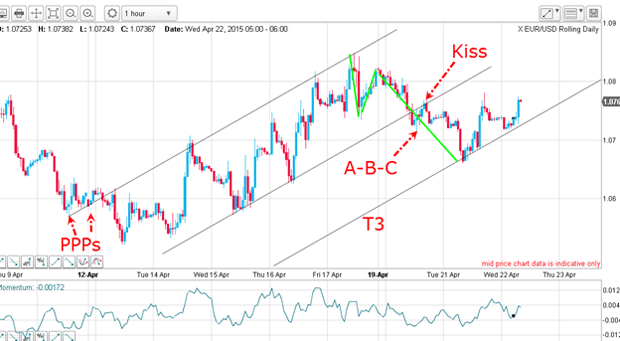
On Monday, the market broke below that tramline, rallied a little to plant a kiss on the underside of that tramline, and then declined. But where to?
Whenever I see a tramline break, my first task is to draw in my third tramline T3 equidistant from the first pair. That gives me my likely line of support where I can expect at least a major pause, and at best a turn.
The market duly obliged as it accurately hit T3 and then proceeded to rally. As I write, it is trading around 100 pips above this T3 low. That is major support!
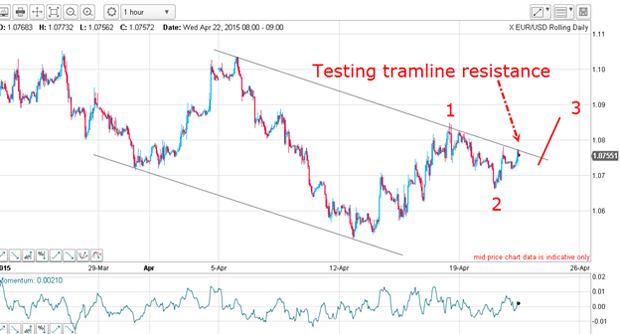
Now looking at the bigger picture, the market is challenging major resistance at my upper tramline. My ongoing thesis is that we are at the start of a large five-wave rally and I have waves 1 and 2 in place. A break above the upper tramline would help validate idea that wave 3 has started. There should be a pile of buy stops around there.

Naturally, this would surprise a lot of dollar bulls who are expecting the euro to implode as they believe contagion would spread after an imminent Greek exit. In fact, many expected the euro to decline below parity last month, but with bullish sentiment towards the euro reaching low single figures, I believed that was highly unlikely at least in the near term.
So far, my trade is on the right track.
Get the latest financial news, insights and expert analysis from our award-winning MoneyWeek team, to help you understand what really matters when it comes to your finances.
John is is a British-born lapsed PhD physicist, who previously worked for Nasa on the Mars exploration team. He is a former commodity trading advisor with the US Commodities Futures Trading Commission, and worked in a boutique futures house in California in the 1980s.
He was a partner in one of the first futures newsletter advisory services, based in Washington DC, specialising in pork bellies and currencies. John is primarily a chart-reading trader, having cut his trading teeth in the days before PCs.
As well as his work in the financial world, he has launched, run and sold several 'real' businesses producing 'real' products.
-
 Average UK house price reaches £300,000 for first time, Halifax says
While the average house price has topped £300k, regional disparities still remain, Halifax finds.
-
 Barings Emerging Europe trust bounces back from Russia woes
Barings Emerging Europe trust has added the Middle East and Africa to its mandate, delivering a strong recovery, says Max King