Your roadmap for gold
John C Burford profits from turbulence in the gold market to lay down a superb set of tramlines for his next trade.
Get the latest financial news, insights and expert analysis from our award-winning MoneyWeek team, to help you understand what really matters when it comes to your finances.
You are now subscribed
Your newsletter sign-up was successful
Want to add more newsletters?

Twice daily
MoneyWeek
Get the latest financial news, insights and expert analysis from our award-winning MoneyWeek team, to help you understand what really matters when it comes to your finances.

Four times a week
Look After My Bills
Sign up to our free money-saving newsletter, filled with the latest news and expert advice to help you find the best tips and deals for managing your bills. Start saving today!
Before I cover gold today, I wanted to drop you a quick note on myGBP trade from Friday, as it confirmed my forecast for an increase in bearish sentiment last week.
You'll remember that I had a long trade working. But the market was hit very hard again, stopping me out at break-even.
I showed the Commitments of Traders (COT) data as of 22 January and my forecast was that the speculators, who were busy accumulating huge short positions, would be increasing them further, since the market had fallen further.
MoneyWeek
Subscribe to MoneyWeek today and get your first six magazine issues absolutely FREE

Sign up to Money Morning
Don't miss the latest investment and personal finances news, market analysis, plus money-saving tips with our free twice-daily newsletter
Don't miss the latest investment and personal finances news, market analysis, plus money-saving tips with our free twice-daily newsletter
The extension of the decline since that date would virtually guarantee it!
Here are the updated figures as of 29 January:
| OPEN INTEREST: 166,060 | ||||||||
| COMMITMENTS | ||||||||
| 57,989 | 47,367 | 3,248 | 85,116 | 84,976 | 146,353 | 135,591 | 19,707 | 30,469 |
| CHANGES FROM01/22/13 (CHANGE IN OPEN INTEREST: 5,240) | ||||||||
| -2,212 | 5,104 | 1,095 | 15,217 | -8,312 | 14,100 | -2,113 | -8,860 | 7,353 |
| PERCENT OF OPEN INTEREST FOR EACH CATEGORY OF TRADERS | ||||||||
| 34.9 | 28.5 | 2.0 | 51.3 | 51.2 | 88.1 | 81.7 | 11.9 | 18.3 |
| NUMBER OF TRADERS IN EACH CATEGORY (TOTAL TRADERS: 98) | ||||||||
| 25 | 30 | 9 | 25 | 30 | 53 | 66 | Row 8 - Cell 7 | Row 8 - Cell 8 |
In particular, the small specs (non-reportables), were piling in with both feet last week.
Remember, this is typically what happens near the end of a run the specs get even more excited after a run has been in progress for some time.
That means I am on the lookout for another tradable low. I hope to report on this in upcoming posts, provided I see some great tramlines, Fibonacci levels, or Elliott waves of course.
I don't want you to fall into this trap
It is the sentiment extremes a universal feature of the herding instinct that creates the highs and lows. These extremes are definitely not created by the news'.
That is hard for many novice traders to accept. Most people come to trading with the conventional view that it is the news that is all-important and that if they follow enough of it, they can conquer the markets. Sadly, experience tells us that this is incorrect.
How many times have you seen a bullish' report come out just as the market nosedives? Of course, after the event, people find all sorts of rationalisations to explain away the inconsistency. The vast majority of opinion' falls into that category.
I do not want you to fall into that trap. We make our money by anticipating the moves and the sentiment readings are just one of several tools that I use.
A moment's thought will convince most that when the vast majority are bullish and have taken long positions, only a small degree of selling could turn the market as piles of sell stops are hit. That is the degree of unbalance that professional traders look to exploit.
The other aspect is this: In a bear run, who are the crazy people doing the buying from the bears? Here, in the GBP/USD market, these crazy people are the commercials (such as banks and trade houses). Many have been around the block a few times and have survived many bull and bear markets. That is why they are considered the smart money. Do you want to bet against them for an extended period?
Yes, you can make money trading with the herd for a while. But at some point, the boat will tip over. Will you be one of the survivors who got in the lifeboat early and saw the danger before the others?
This roadmap can guide my trading
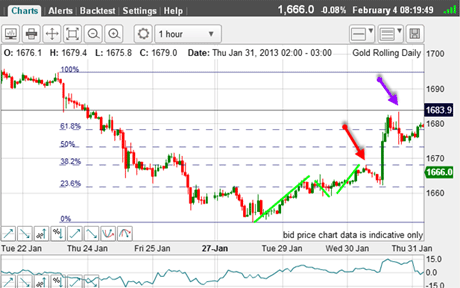
OK, back to gold. Last Wednesday, I showed some short-term trading opportunities in gold based on Fibonacci retracements. Then, the market was staging a rally and I had chickened out of my long trade, and wasasking whether I should initiate a new short:

(Click on the chart for a larger version)
The rally had carried to a precise Fibonacci 38% retrace (red arrow), which could be a possible turning point. However, I did hold off because my A-B-C (green bars) did not look terribly solid my B wave was not definite enough.
And that was a good decision!
The market rallied further and right to the Fibonacci 76% level (purple arrow). That was a much better entry, of course.
That was another possible Fibonacci trade.
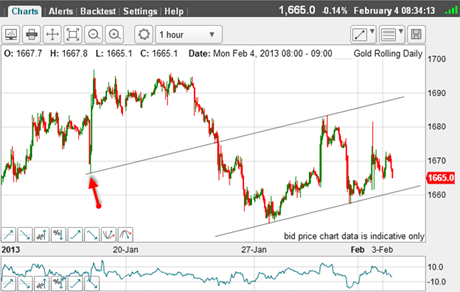
As it happened, I sat on my hands, suspecting a volatile period ahead. This is the current chart:

(Click on the chart for a larger version)
And what a choppy market! Up until then, I did not have enough on the chart to enable tramlines to be drawn but now I do, in spades.
I have a superb prior pivot point(PPP - red arrow) on my upper line, and precise touch points in upper and lower lines. That is remarkable, since in gold, I often have to deal with throw-overs when drawing tramlines.
With these tramlines, I now have a roadmap to guide my trading.
This morning, the marketwas heading down to hitmy lower line. I will be ready to trade when that occurs.
If you're a new reader, or need a reminder about some of the methods I refer to in my trades, then do have a look at my introductory videos:
The essentials of tramline trading
An introduction to Elliott wave theory
Advanced trading with Elliott waves
Don't miss my next trading insight. To receive all my spread betting blog posts by email, as soon as I've written them, just sign up here . If you have any queries regarding MoneyWeek Trader, please contact us here.
Get the latest financial news, insights and expert analysis from our award-winning MoneyWeek team, to help you understand what really matters when it comes to your finances.
John is is a British-born lapsed PhD physicist, who previously worked for Nasa on the Mars exploration team. He is a former commodity trading advisor with the US Commodities Futures Trading Commission, and worked in a boutique futures house in California in the 1980s.
He was a partner in one of the first futures newsletter advisory services, based in Washington DC, specialising in pork bellies and currencies. John is primarily a chart-reading trader, having cut his trading teeth in the days before PCs.
As well as his work in the financial world, he has launched, run and sold several 'real' businesses producing 'real' products.
-
 Should you buy an active ETF?
ETFs are often mischaracterised as passive products, but they can be a convenient way to add active management to your portfolio
-
 Power up your pension before 5 April – easy ways to save before the tax year end
With the end of the tax year looming, pension savers currently have a window to review and maximise what’s going into their retirement funds – we look at how