A great example of extreme sentiment
The pound is sinking under the weight of extreme bearish sentiment. John C Burford uses his trading methods to seek out the bottom of the market for a stress-free trade.
Get the latest financial news, insights and expert analysis from our award-winning MoneyWeek team, to help you understand what really matters when it comes to your finances.
You are now subscribed
Your newsletter sign-up was successful
Want to add more newsletters?

Twice daily
MoneyWeek
Get the latest financial news, insights and expert analysis from our award-winning MoneyWeek team, to help you understand what really matters when it comes to your finances.

Four times a week
Look After My Bills
Sign up to our free money-saving newsletter, filled with the latest news and expert advice to help you find the best tips and deals for managing your bills. Start saving today!
TABLE.ben-table TABLE {BORDER-BOTTOM: #2b1083 1px solid; BORDER-LEFT: #2b1083 1px solid; BORDER-TOP: #2b1083 1px solid; BORDER-RIGHT: #2b1083 1px solid}TH {TEXT-ALIGN: center; BORDER-LEFT: #a6a6c9 1px solid; PADDING-BOTTOM: 2px; PADDING-LEFT: 1px; PADDING-RIGHT: 1px; BACKGROUND: #2b1083; COLOR: white; FONT-SIZE: 0.8em; FONT-WEIGHT: bold; PADDING-TOP: 2px}TH.first {TEXT-ALIGN: left; BORDER-LEFT: 0px; PADDING-BOTTOM: 2px; PADDING-LEFT: 1px; PADDING-RIGHT: 1px; FONT-SIZE: 0.8em; PADDING-TOP: 2px}TR {BACKGROUND: #fff}TR.alt {BACKGROUND: #f6f5f9}TD {TEXT-ALIGN: center; BORDER-LEFT: #a6a6c9 1px solid; PADDING-BOTTOM: 2px; PADDING-LEFT: 1px; PADDING-RIGHT: 1px; COLOR: #000; FONT-SIZE: 0.8em; PADDING-TOP: 2px}TD.alt {BACKGROUND-COLOR: #f6f5f9}TD.bold {FONT-WEIGHT: bold}TD.first {TEXT-ALIGN: left}TD.left {TEXT-ALIGN: left}TD.bleft {TEXT-ALIGN: left; FONT-WEIGHT: bold}
Today, I will be going off piste a touch in covering the pound/US dollar, or cable', as it is affectionately known. The name comes from the early days of transatlantic communication, when great cable-laying ships ploughed the Atlantic to bring the continents together. GBP/USD currency traders used the first cables to trade, and the name has stuck ever since.
This market is a great example of extreme sentiment. That's the point at which turns often occur, which catch the majority flat-footed. I love doing that!
MoneyWeek
Subscribe to MoneyWeek today and get your first six magazine issues absolutely FREE

Sign up to Money Morning
Don't miss the latest investment and personal finances news, market analysis, plus money-saving tips with our free twice-daily newsletter
Don't miss the latest investment and personal finances news, market analysis, plus money-saving tips with our free twice-daily newsletter
The currency markets today are highly fragmented in terms of sentiment. There is massive bearish sentiment towards the yen, and the USD/JPY cross, which I follow, is in vertical lift-off mode. Then the EUR/USD cross sports massive bullish sentiment with many forecasting an extension of the rally to the 1.40 area.
And then there is poor old cable! Sentiment is becoming more and more pessimistic due to the flat UK economy.
As an example, here is a headline from a recent Sunday Times article: "Sterling set to slide as trade gap widens".
The article makes a convincing case, citing many negative-looking statisticssuch asthe trade gap, the budget deficit (increasing government borrowings), and the possible UK exit from the EU.
With fundamentals like this, who would want to challenge the bears?
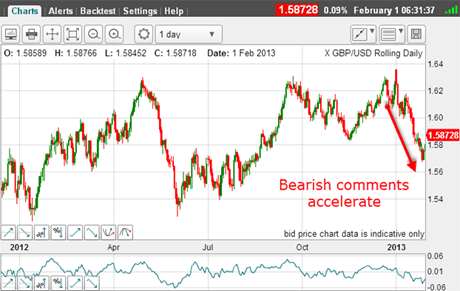
Here is the daily chart of GBP/USD for the past year:
(Click on the chart for a larger version)
Right away, we see no clear trend. In fact, the market is trading in about the same area as a year ago!
But in the meantime, there have been many large swings (these are the swings I attempt to catch with my methods, of course!). And since the peak on 2 January at 1.6360, it has been downhill all the way, while the bearish comments accelerated.
This is normal. What we have to realise is this: by the time you read headlines, it will be time to look for a market turn and a tradable low. And this is exactly what I have done.
The other thing we have to realise is that there is another currency involved - the US dollar. While the pound was sinking in January, allthe media'seyes were on it, while the dollar was virtually ignored, because traders had breathed a collective sigh of relief over the non-event of the fiscal cliff.
Does Commitments of Traders (COT) agree with the headlines?
So let's see what real traders were doing in the futures market the COT data.
Here are the latest figures as of 22 January when the market was trading around 1.58:
| OPEN INTEREST: 160,820 | ||||||||
| COMMITMENTS | ||||||||
| 60,201 | 42,623 | 2,153 | 69,899 | 93,288 | 132,253 | 137,704 | 28,567 | 23,116 |
| CHANGES FROM01/15/13 (CHANGE IN OPEN INTEREST: -2,475) | ||||||||
| -3,595 | 6,805 | 585 | 8,291 | -15,265 | 5,281 | -7,875 | -7,756 | 5,400 |
| PERCENT OF OPEN INTEREST FOR EACH CATEGORY OF TRADERS | ||||||||
| 37.4 | 26.3 | 1.3 | 43.5 | 58.0 | 82.2 | 85.6 | 17.8 | 14.4 |
| NUMBER OF TRADERS IN EACH CATEGORY (TOTAL TRADERS: 95) | ||||||||
| 25 | 29 | 7 | 22 | 30 | 52 | 61 | Row 8 - Cell 7 | Row 8 - Cell 8 |
True to form, the large speculators (non-commercials), who are largely hedge funds, massively increased their shorts/reduced their longs. These traders are primarily trend-followers, using algo systems.
A similar pattern exists in the small speculator sector, where there's a massive swing to the bearish camp. They were obviously buying the bearish story.
Meanwhile, the trade (commercials) took the other side of these trades.
Since then, the market has declined further and I am confident that the next report will show an extension of these changes.
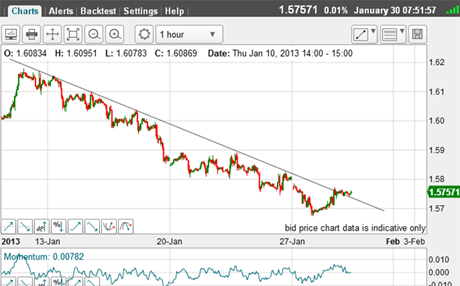
So, early this week, I was on the lookout for a low. And I did find a great set-up on Tuesday:
(Click on the chart for a larger version)
I could draw a superb trendline of the decline off the mid-January high and the market was challenging that line. Was this the turn I was looking for?
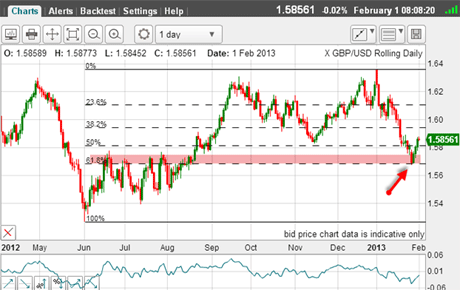
To give me more evidence, I needed to go back to the long-term daily chart:
(Click on the chart for a larger version)
Aha! The market declined to 1.57 bang on the Fibonacci 63% retrace of the huge move up from the sub-1.54 low to the sub-1.64 high (red arrow). This is exhibit A.
And then, the 1.57 level is right on the support zone provided by the highs from last summer (pink bar). This is exhibit B.
Exhibit C is, of course, the extreme bearish sentiment, which usually precedes a turn.
Putting all this together, I had a strong case for at least a decent bounce and that 1.57 was a tradable low.
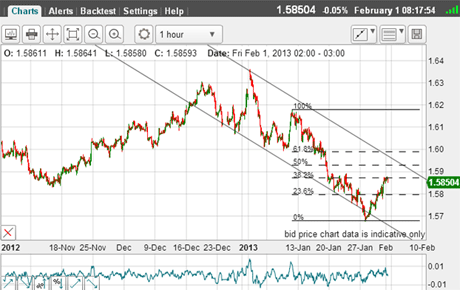
Let's forward to this morning:
(Click on the chart for a larger version)
I have a tramline pair, but it is less than ideal, so I am not placing great store by it yet.
Since the 1.57 level is my new low, I have my Fibonacci levels using the most recent significant high as high pivot point.
This is the level where I expect some resistance.
Trader tip: In Wednesday's post, I covered this point at length. Get your Fibonacci tool working as soon as you can andidentify your pivot points. These levels will prepare you for likely support/resistance. Do not trade unprepared!
Where do we go from here?
I have a long trade and my protective stop is now at break even. But what are the likely scenarios from here?
Let's examine the move down from early January:
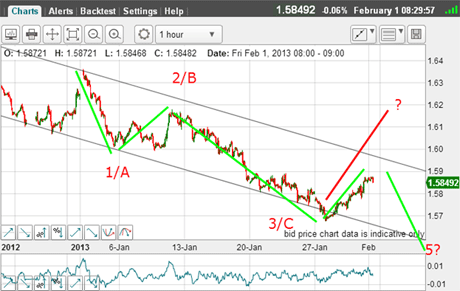
(Click on the chart for a larger version)
These are my main options (there are others).
We are either dealing with a large A-B-C, where the rally will progress, or with a five-wave pattern, leading to a new low well below 1.57.
I really do not have anything else to go on, and so I will sit with my long trade, happy in the knowledge that whatever happens, I will not lose money on it.
And that, believe me, is a very comfortable position to be in. I advise all traders, no matter what systems you use, to do likewise. It is the low-stress way to trade and stress is what kills trading performance.
If you're a new reader, or need a reminder about some of the methods I refer to in my trades, then do have a look at my introductory videos:
The essentials of tramline trading
An introduction to Elliott wave theory
Advanced trading with Elliott waves
Don't miss my next trading insight. To receive all my spread betting blog posts by email, as soon as I've written them, just sign up here . If you have any queries regarding MoneyWeek Trader, please contact us here.
Get the latest financial news, insights and expert analysis from our award-winning MoneyWeek team, to help you understand what really matters when it comes to your finances.
John is is a British-born lapsed PhD physicist, who previously worked for Nasa on the Mars exploration team. He is a former commodity trading advisor with the US Commodities Futures Trading Commission, and worked in a boutique futures house in California in the 1980s.
He was a partner in one of the first futures newsletter advisory services, based in Washington DC, specialising in pork bellies and currencies. John is primarily a chart-reading trader, having cut his trading teeth in the days before PCs.
As well as his work in the financial world, he has launched, run and sold several 'real' businesses producing 'real' products.
-
 ISA fund and trust picks for every type of investor – which could work for you?
Whether you’re an ISA investor seeking reliable returns, looking to add a bit more risk to your portfolio or are new to investing, MoneyWeek asked the experts for funds and investment trusts you could consider in 2026
-
 The most popular fund sectors of 2025 as investor outflows continue
It was another difficult year for fund inflows but there are signs that investors are returning to the financial markets