Will last week’s euro rally last?
The euro's recent rally is showing all the hallmarks of running out of steam, says John C Burford. Here, he puts his trading methods to the test in the hunt for his next entry point.
Get the latest financial news, insights and expert analysis from our award-winning MoneyWeek team, to help you understand what really matters when it comes to your finances.
You are now subscribed
Your newsletter sign-up was successful
Want to add more newsletters?

Twice daily
MoneyWeek
Get the latest financial news, insights and expert analysis from our award-winning MoneyWeek team, to help you understand what really matters when it comes to your finances.

Four times a week
Look After My Bills
Sign up to our free money-saving newsletter, filled with the latest news and expert advice to help you find the best tips and deals for managing your bills. Start saving today!
I have concentrated on the super trading lessons provided by the Dow recently, so I have neglected the euro and for good reason.
The long-term bear market has taken the EUR/USD rate into new low ground, close to my long-standing 1.20 target.
The euro is taking a breather. This typically occurs after a solid move in an old' trend.
MoneyWeek
Subscribe to MoneyWeek today and get your first six magazine issues absolutely FREE

Sign up to Money Morning
Don't miss the latest investment and personal finances news, market analysis, plus money-saving tips with our free twice-daily newsletter
Don't miss the latest investment and personal finances news, market analysis, plus money-saving tips with our free twice-daily newsletter
Frankly, I have been waiting for the market to form new patterns to trade off.
As a swing trader, I have been out of this market during this period, as I anticipated a choppy market after all, sentiment towards the euro has been at rock bottom and was ripe for a reversal of some kind.
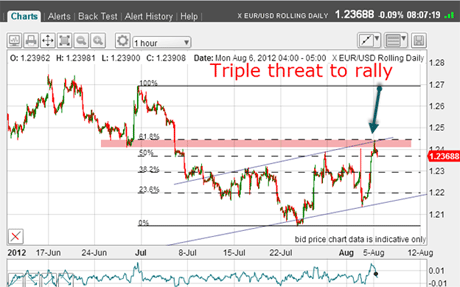
But today, things are perking up! I have found a new tramline set and a nice Fibonacci retrace. Here is the hourly chart:

(Click on the chart for a larger version)
Last week was an absolute swing-trading horror show, with Thursday's whiplash of around 300 pips followed by Friday's huge rally back up above Thursday's spike high.
Recall that in my Friday post, I showed that the T-bond chart had a similar rapid spike and that the spike high and low both lay on my tramlines.
We see the equivalent conformation in the euro. My upper tramline contains several excellent touch-points, including last week's spike highs and sports a great prior pivot point (PPP).
And my lower tramline covers both recent lows, with Thursday's slight overshoot.
But that's not all! I have my Fibonacci levels drawn off the most recent major high at 1.27 as the high pivot and the recent 1.2060 low as the low pivot point
The market hits four resistance points
The market made it exactly to the 62% level overnight, in another spike.
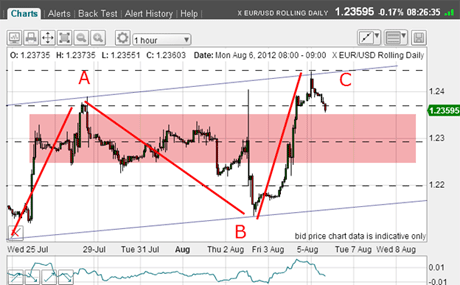
And there's even more! The form of the rally off the 1.2060 low can be considered an A-B-C my ideal form for a relief rally. The only fly in the ointment is that there is no momentum divergence at the C wave high.
And to cap it all off, the market has rallied into overhead resistance (pink bar above).
Putting these three points together, I have made a case that the rally is likely exhausted and new lows beckon.
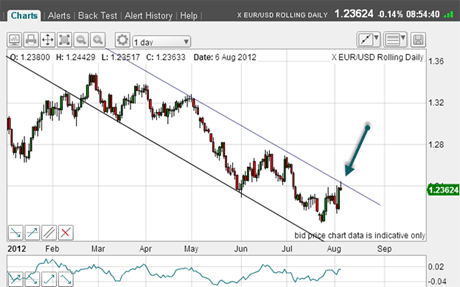
To strengthen my case, here is the daily chart:

(Click on the chart for a larger version)
My lower tramline is excellent with good PPP and several touch-points. The market has carried to my upper line. So there is resistance on the daily chart.
Sadly, the best time for a short trade was very early this morning when, let's say, my attention was not on trading. And that presents a slight problem for swing traders, since we wish to make precision entries certainly as close as possible to the Fibonacci levels.
So, in the real world, we must compromise. Here is the latest chart I have just taken off my screen:

(Click on the chart for a larger version)
So how would I assess the situation? OK, I missed my ideal short entry above 1.24, but was there a better entry than the trade presented at 1.2360? I have highlighted in pink the support zone offered by last week's trading range. Much of last week's trading occurred in this zone.
When the market comes back to test these congestion zones, there usually occurs much squaring of positions. Some who shorted in this zone saw their positions worsen on Friday, and will be only too happy to escape today without a loss.
Also, those who went long in the zone will be tempted to escape when they see their profits being eroded.
At every moment, there are many cross-currents at work, which produce the waves we study.
So, this morning, I will be looking for opportunities to take a short trade.
Naturally, if the market rallies above my upper tramline, I will need to re-assess.
But right now, the odds do favour a resumption of the major downtrend in the euro. And remember, as I have previously said, the US dollar is in a major third wave up and these third waves very often carry on for much longer than many expect, especially in currencies, which are notorious for persistence of trend.
I still have my 1.20 target in mind, and lower ones as well around the 1.17 area. Will they be hit? And will the market hit again my lower daily tramline in the 1.10 area? If so, a long-term trade would produce spectacular profits.
These long-term traders are seeing a great entry opportunity here with the market touching the upper daily tramline, of course.
The recent gyrations have been motivated by the twists and turns in eurozone policy, with last week's Draghi drama a highlight. But with the long-term trend firmly bearish, it would take a monumental switch in sentiment to turn the market around.
If you're a new reader, or need a reminder about some of the methods I refer to in my trades, then do have a look at my introductory videos:
The essentials of tramline trading
An introduction to Elliott wave theory
Advanced trading with Elliott waves
Don't miss my next trading insight. To receive all my spread betting blog posts by email, as soon as I've written them, just sign up here . If you have any queries regarding MoneyWeek Trader, please contact us here.
Get the latest financial news, insights and expert analysis from our award-winning MoneyWeek team, to help you understand what really matters when it comes to your finances.
John is is a British-born lapsed PhD physicist, who previously worked for Nasa on the Mars exploration team. He is a former commodity trading advisor with the US Commodities Futures Trading Commission, and worked in a boutique futures house in California in the 1980s.
He was a partner in one of the first futures newsletter advisory services, based in Washington DC, specialising in pork bellies and currencies. John is primarily a chart-reading trader, having cut his trading teeth in the days before PCs.
As well as his work in the financial world, he has launched, run and sold several 'real' businesses producing 'real' products.
-
 Should you buy an active ETF?
ETFs are often mischaracterised as passive products, but they can be a convenient way to add active management to your portfolio
-
 Power up your pension before 5 April – easy ways to save before the tax year end
With the end of the tax year looming, pension savers currently have a window to review and maximise what’s going into their retirement funds – we look at how