Two tactics for shorting market rallies
Shorting market rallies can be a dangerous business. Markets can carry on rising for much longer than you might think. But Elliott wave and Fibonacci theories can help you tell which way the market is likely to move.
Get the latest financial news, insights and expert analysis from our award-winning MoneyWeek team, to help you understand what really matters when it comes to your finances.
You are now subscribed
Your newsletter sign-up was successful
Want to add more newsletters?

Twice daily
MoneyWeek
Get the latest financial news, insights and expert analysis from our award-winning MoneyWeek team, to help you understand what really matters when it comes to your finances.

Four times a week
Look After My Bills
Sign up to our free money-saving newsletter, filled with the latest news and expert advice to help you find the best tips and deals for managing your bills. Start saving today!
When your strategy is to sell market rallies because you believe we are in a bear market, your tactics need to be carefully considered rallies can carry on for far longer and further than you think possible.
Of course, you may be wrong in thinking we are in a bear market at all and that is where Elliott wave analysis, combined with Fibonacci retracements, comes into its own.
These two concepts can give you definite price points that tell, one way or the other, whether you are dealing with a bull or a bear move. This is valuable information.
MoneyWeek
Subscribe to MoneyWeek today and get your first six magazine issues absolutely FREE

Sign up to Money Morning
Don't miss the latest investment and personal finances news, market analysis, plus money-saving tips with our free twice-daily newsletter
Don't miss the latest investment and personal finances news, market analysis, plus money-saving tips with our free twice-daily newsletter
Here is a recent example in the FTSE 100.
If, like me, you believe the market is in a long-term bear market and that large-scale rallies are to be shorted, you will be looking for opportunities to short.
Shorting is hazardous but can be profitable
Since the blow-off lows made in 2008/2009, the market has staged an impressive rally. Shorting into it has been hazardous for many traders, to say the least.
But it is possible to make profits from short sales. For example, I spotted the high of April last year and took profits from that down move.
How did I do it?
By recognising that the 5,850 area was a precise Fibonacci retrace of the 2007-2009 bear move;
By observing that there was a clear five-wave Elliott Wave pattern up from the 2009 low, and;
By checking the negative divergence with momentum at the peak.
But that was not the end of the rally, as the market moved into new high ground late last year.
That surprised me, as I had expected the bear market to resume after all, five complete Elliott waves normally mean the move is over.
The greatest force in the market
But I had not reckoned with the greatest force in the market consensus herding!
What do I mean? Simply, the stock market industry is highly biased towards the long side.
All participants, from financial advisors to professional economists to money managers to TV pundits, have careers that are based on following the herd.
The only exceptions to this herding behaviour are the independent commentators and hedge fund managers (who are able to short stocks).
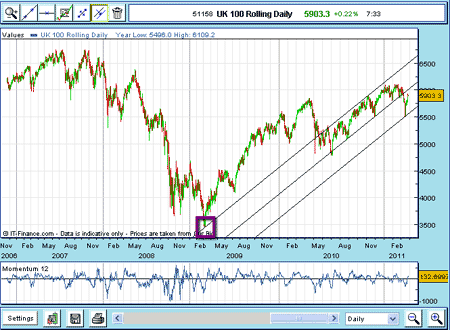
In any case, the market has been in rally mode since last summer and trading has been confined to my tramlines:

(Click on the chart for a larger version)
I have drawn the first tramline which passes through the significant low in February 2009 (marked in the purple box). This line has provided resistant to the rallies to date.
Now let's zero in on recent trading:

(Click on the chart for a larger version)
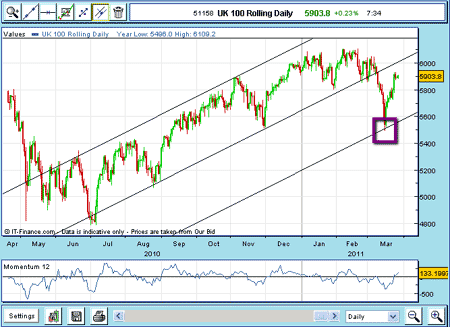
I have my upper tramline, and my lower tramline is easily found it passes through the lows of August and November on the button.
Note that all along my tramlines, there were opportunities for short-term traders to trade (shorting from the upper tramline and then buying at the lower line).
Tramlines can be a powerful forecasting tool
But look at what has been occurring recently.
If I draw an equidistant line below the lower tramline, I see that the market in March broke below and hit my new lower tramline also on the button. This is marked by a purple box.
What is crucial to understand is that I could have drawn all three tramlines way back in December, when I had enough points to construct my lines.
The hit occurred three months later.
That gives me a powerful tool for forecasting that any dips would first meet my third tramline and a place to take profits on a short trade.
Of course, I could not predict when or where along the line that would occur. Only in real time, when the market was breaking, could I do that.
But even so, what a powerful insight that gives me weeks and months into the future. There are not many trading systems that can do that.
Now, let's look at trading over the past few days.
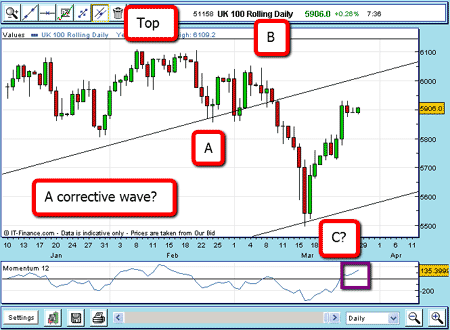
The market rallied to the 6100 level in mid-February and has dipped 600 pips since then to my new lower tramline, and is staging another rally as I write:

(Click on the chart for a larger version)
Note the dip has been in three clear A-B-C waves (so far).
But this is a corrective pattern according to Elliott wave principles, so we should expect a resumption of the rally. The top is not likely to be in yet.
If true, we should either look for long trades, or wait until the rally has carried to an important chart point before trying a short sale.
Note that the market is pushing up against the underside of my tramline and may well stall there.
I will develop this theme in future posts.
NB: Don't miss my next bit of trading advice. To receive all my spread betting blog posts by email, as soon as I've written them, just sign up here .
Get the latest financial news, insights and expert analysis from our award-winning MoneyWeek team, to help you understand what really matters when it comes to your finances.
John is is a British-born lapsed PhD physicist, who previously worked for Nasa on the Mars exploration team. He is a former commodity trading advisor with the US Commodities Futures Trading Commission, and worked in a boutique futures house in California in the 1980s.
He was a partner in one of the first futures newsletter advisory services, based in Washington DC, specialising in pork bellies and currencies. John is primarily a chart-reading trader, having cut his trading teeth in the days before PCs.
As well as his work in the financial world, he has launched, run and sold several 'real' businesses producing 'real' products.
-
 ISA fund and trust picks for every type of investor – which could work for you?
Whether you’re an ISA investor seeking reliable returns, looking to add a bit more risk to your portfolio or are new to investing, MoneyWeek asked the experts for funds and investment trusts you could consider in 2026
-
 The most popular fund sectors of 2025 as investor outflows continue
It was another difficult year for fund inflows but there are signs that investors are returning to the financial markets